
Computer Vision Manufacturing: A Quality Inspection Guide for Plant Leaders
Computer vision manufacturing systems use industrial cameras and trained AI models to inspect every part on a line, flag flaws in milliseconds, and push rejects off the conveyor before they reach packing. For plant and quality heads, the appeal is easy to see: full coverage instead of sampling, and the same judgment on the last part of a night shift as on the first part of the morning. The harder questions are about data, integration, and whether the payback holds up on your specific line.
This guide works through those questions in the order a first project usually meets them. It covers why manual checks plateau, how the technology works, what it needs to learn, and how to handle ROI, limitations, and rollout. Where we cite a number, we name the source so you can check it yourself.
What Is Vision-Based Quality Inspection?
Computer vision quality inspection is the use of cameras, controlled lighting, and machine learning models to judge automatically whether a product meets its visual specification, then act on that judgment without waiting for a person. The camera captures each part, the model compares what it sees with what it learned from labeled examples, and the line’s control system accepts, rejects, or holds the part for review. Every decision is logged with the image behind it, which gives quality teams a searchable record instead of a tally sheet.
The technology belongs to a broader family that includes classic machine vision, automated optical inspection (AOI) in electronics, and industrial metrology. What sets the newer approach apart is deep learning: rather than following rules an engineer wrote, the system learns what a flaw looks like from examples. That matters most when flaws are irregular, such as a scratch that never appears in the same place or shape twice.
Manual, Rule-Based, and Deep Learning Inspection Compared
The three approaches differ in how they decide, how they cope with variation, and what it costs to change them. Most plants already run at least two. The table shows where each one fits.
Factor
How it decides
Manual inspection
Inspector judgment against a spec or boundary samples
Rule-based machine vision
Thresholds and templates an engineer programs
Deep learning vision
A model trained on labeled images of good and bad parts
Factor
Coverage on fast lines
Manual inspection
Often sampled
Rule-based machine vision
Every part
Deep learning vision
Every part
Factor
Handles texture, color, and grain variation
Manual inspection
Yes, but inconsistently between people
Rule-based machine vision
Poorly, because fixed rules break
Deep learning vision
Well, if training data covers the variation
Factor
Changing to a new product
Manual inspection
Retrain people
Rule-based machine vision
Reprogram rules
Deep learning vision
Add labeled examples and retrain
Factor
Best fit
Manual inspection
Low volume, complex judgment
Rule-based machine vision
Fixed checks such as presence or one dimension
Deep learning vision
Cosmetic and irregular flaws, mixed product lines
Rule-based systems are not obsolete. For a fixed measurement under stable lighting, such as a hole diameter, they can be cheaper and easier to validate. Many plants run both, with rules handling simple checks and a learned model handling the flaws nobody can describe in an equation.
Why Manual Inspection Hits a Ceiling
Manual inspection hits a ceiling because human attention fades on repetitive visual tasks, people disagree about borderline flaws, and fast lines force sampling instead of checking every unit. None of this is a criticism of inspectors. It describes what the job asks of the human visual system across an eight or twelve hour shift.
The research here is old and consistent. In a study of visual inspection for precision manufactured parts, Sandia National Laboratories found that inspectors’ hit rates were not much better than an industry average of about 80%, and that those hits came with an unusually high scrap rate (Sandia National Laboratories, 2015). On the floor, the limits usually show up in four ways.0
Vigilance decay. Accuracy tends to slip as a shift goes on, especially when real flaws are rare.
Subjectivity. Two experienced inspectors can grade the same mark differently, with no record of why.
Sampling. When the line outruns the human eye, plants check a few parts per batch and hope the rest match.
No data trail. Tally sheets record counts, not images, so root cause analysis starts from memory.
The cost lands in scrap, rework, warranty claims, and lost customers. The Institute of Industrial and Systems Engineers (IISE) reports that researchers estimate the cost of poor quality in manufacturing averages around 15% of sales, ranging from 5% to 35% depending on product complexity. Visibility is weak too: in the 2025 ASQE Insights on Excellence Cost of Quality Report, only 31% of respondents said they fully understand how quality costs affect their organization’s financial performance.
How Computer Vision Finds Defects in Real Time
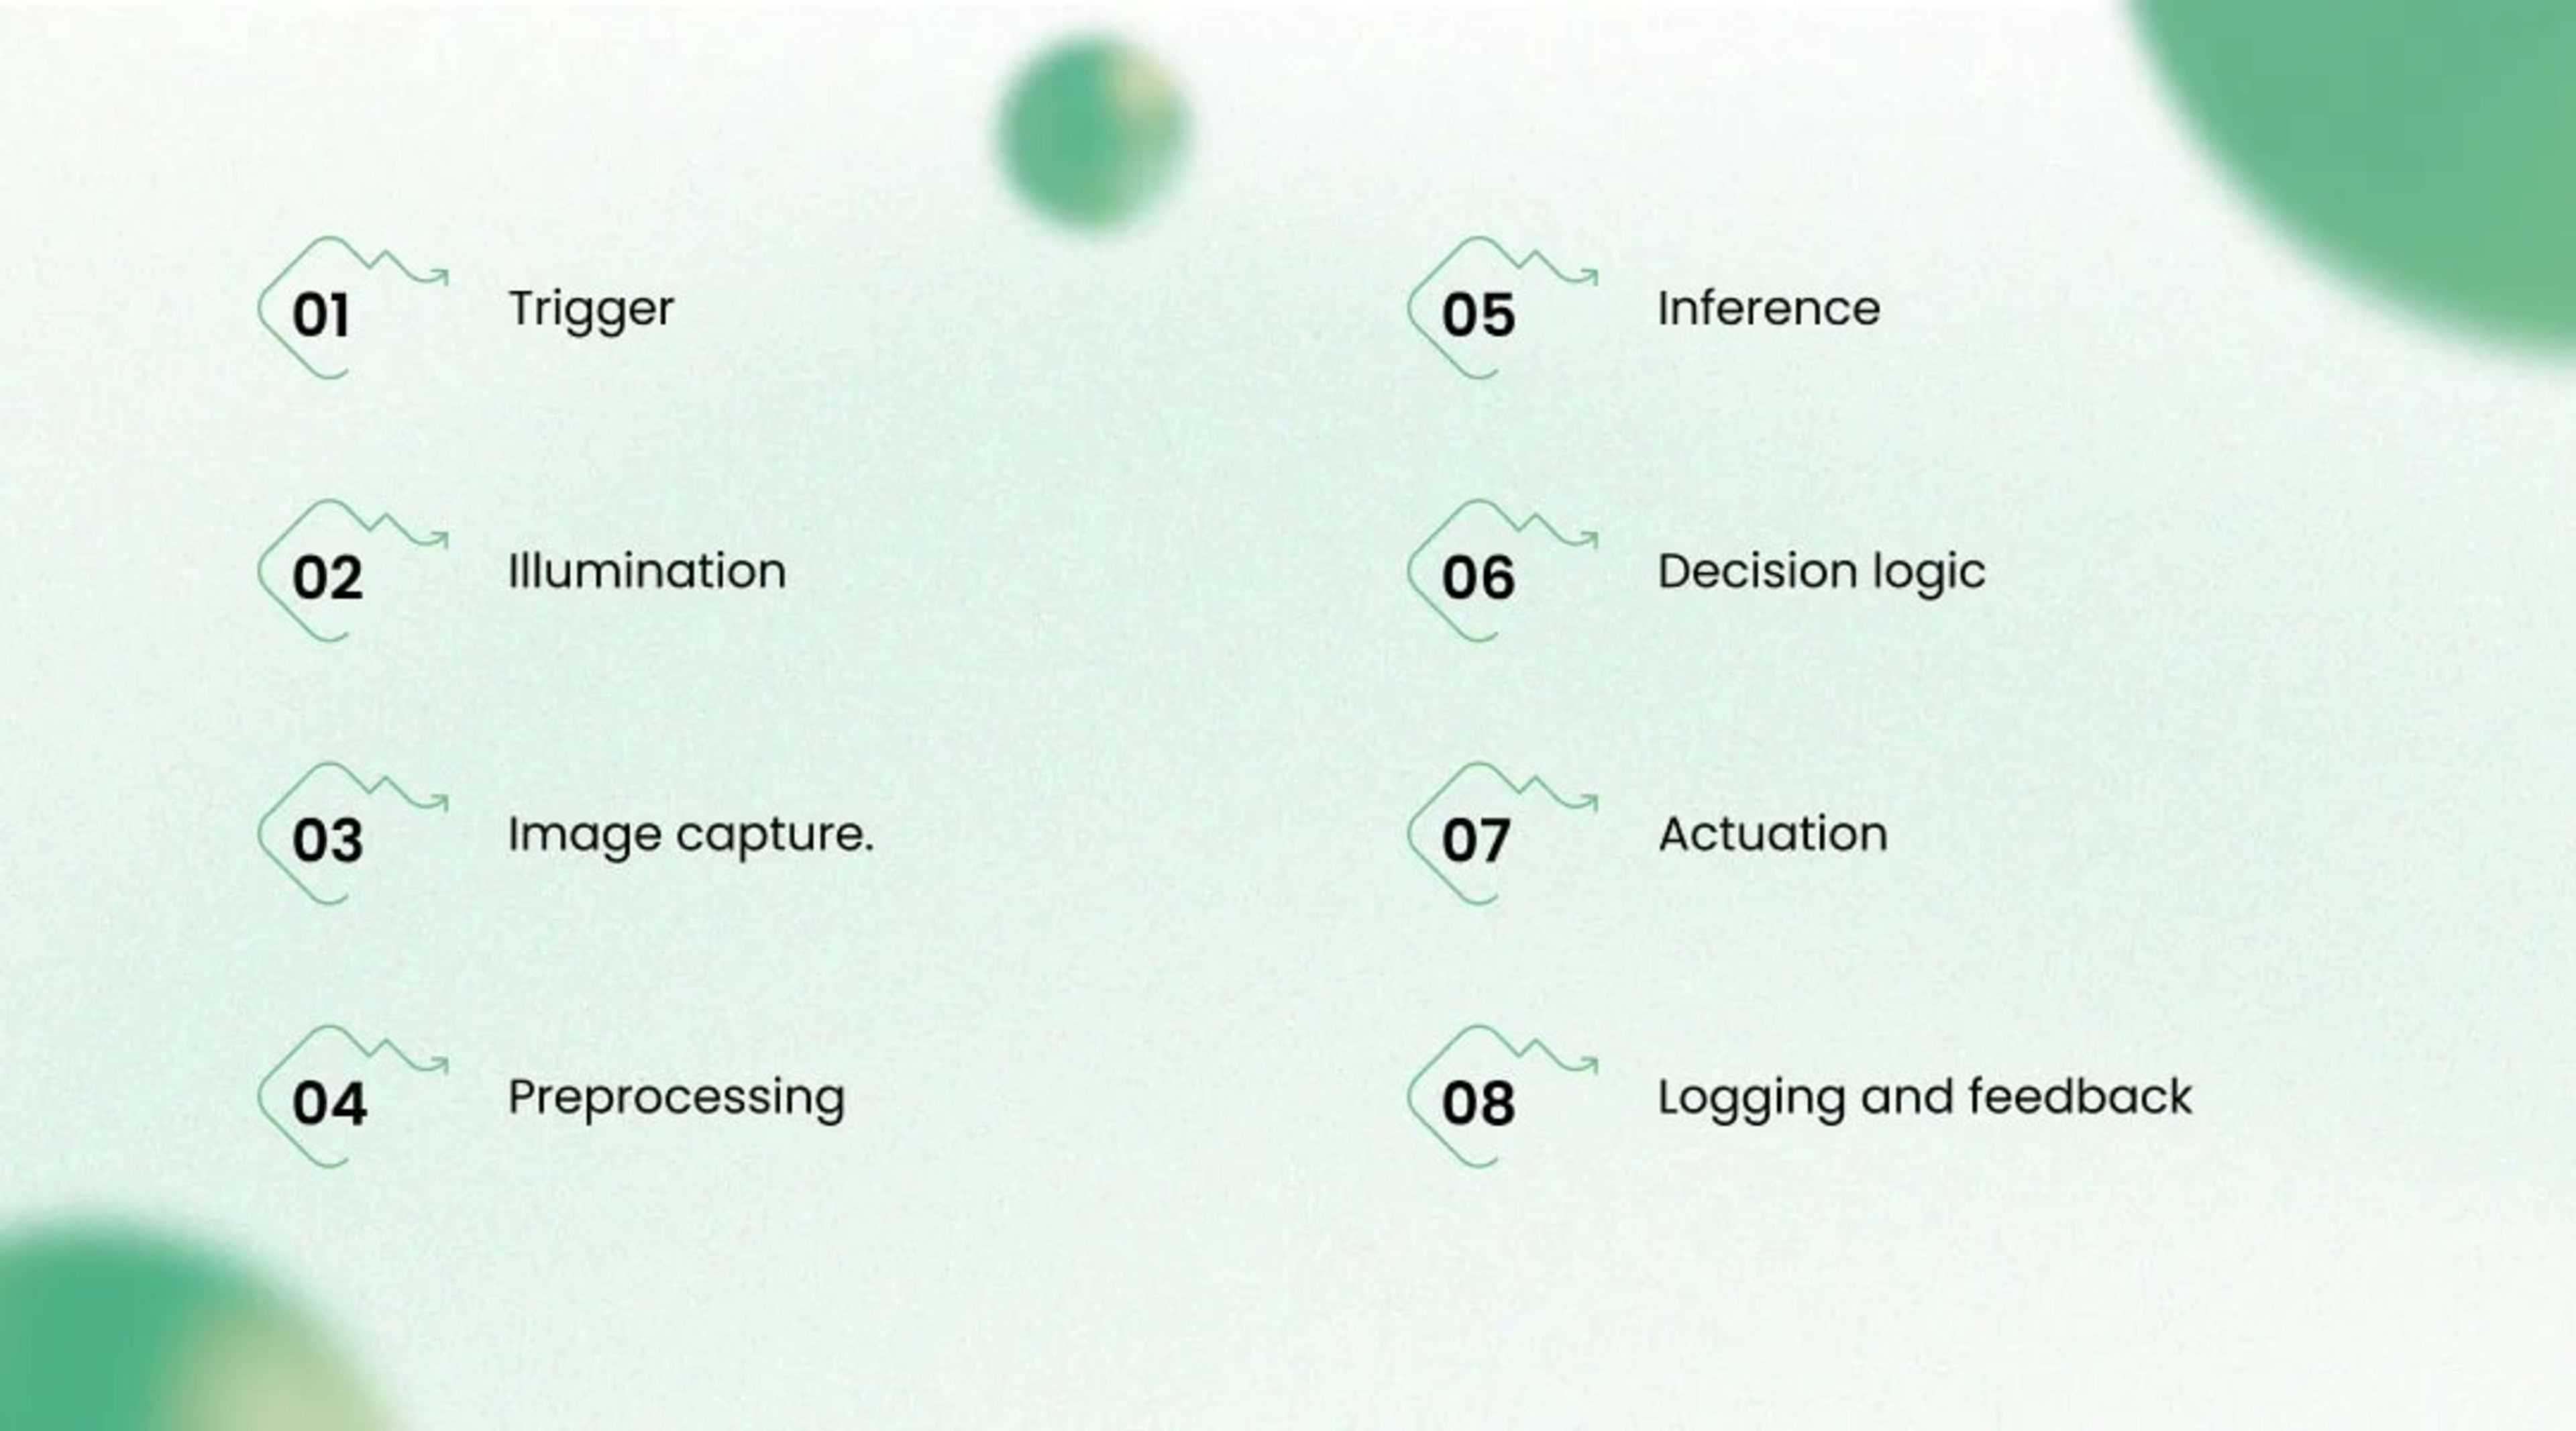
A vision inspection system finds flaws in real time by capturing an image the moment a part reaches the station, running it through a trained model on nearby hardware, and sending a pass or reject signal to the line’s controller before the part reaches the diverter. The loop usually finishes within the gap between consecutive parts. It follows the same eight stages on almost every line.
Trigger. A photoelectric sensor or encoder signals that a part has arrived, so the camera fires at the right position.
Illumination. Lighting chosen for the flaw type, such as low-angle dark-field light for scratches or a backlight for silhouettes, makes the flaw visible.
Image capture. An area-scan camera photographs discrete parts, while a line-scan camera images continuous material such as film, steel strip, or fabric.
Preprocessing. Software crops to the region of interest and normalizes exposure so the model sees consistent input.
Inference. The model classifies the part, boxes each flaw, or outlines it pixel by pixel, and attaches a confidence score.
Decision logic. Rules turn that output into an action: reject above one confidence level, send to a person in a middle band, pass below.
Actuation. The programmable logic controller (PLC) fires an air jet, pusher, or diverter gate to remove the part.
Logging and feedback. The image, verdict, and production context go to the manufacturing execution system (MES) or a quality database, and uncertain cases become new training data.
What Real Time Means on a Moving Line
Real time on a production line means the system decides before the part reaches the reject mechanism, which sets a latency budget measured in milliseconds. That budget is why most deployments run inference on edge computing hardware, such as an industrial PC, smart camera, or compact GPU module near the line, instead of sending every frame to the cloud. Cloud infrastructure still helps with image storage, retraining, and comparing performance across sites.
Flaw Types a Vision System Can Catch
Vision systems handle five broad categories of visual checks, and most first projects start with one. A single station can combine categories, such as label print and cap position on a packaging line. The table maps each category to typical industries.
Check type
Surface flaws
Typical examples
Scratches, dents, cracks, stains, porosity
Common industries
Metal parts, automotive panels, glass, textiles
Check type
Dimensional and geometric
Typical examples
Gap and flush, hole position, warp, burrs
Common industries
Machined parts, castings, molded plastics
Check type
Assembly verification
Typical examples
Missing screws, reversed or misaligned components
Common industries
Electronics, appliances, automotive subassemblies
Check type
Print, label, and code
Typical examples
Smudged date codes, wrong labels, unreadable barcodes (read with OCR)
Common industries
Food, beverage, pharma, consumer packaging
Check type
Contamination and fill
Typical examples
Foreign particles, underfilled containers, open caps
Common industries
Food, beverage, pharmaceuticals
Textiles are a good example of where learned models earn their keep. Weaving faults, holes, slubs, and shade variation change shape endlessly, which makes them hard to describe with fixed rules. Wood, leather, and other natural materials raise the same challenge.
Data Collection and Model Training
A vision model learns from labeled images of good and defective parts, so the quality of the data and the consistency of its labels decide performance more than the choice of algorithm. In computer vision manufacturing projects, this point is routinely underrated. Teams spend weeks comparing model architectures and days on the dataset, when the ratio should usually be reversed.
Agree on What a Defect Is Before You Collect Images
The first deliverable of any project should be a defect catalog, not a dataset. It lists every defect class with photographs and states the accept or reject limit, for instance that a scratch below a set length on a hidden surface is acceptable. Most plants have pieces of this in boundary samples, customer specifications, and senior inspectors’ heads, but rarely in one document.
Writing it down forces disagreements into the open early. If two inspectors grade the same part differently, a model trained on both sets of labels will learn their confusion. Settle those cases in a calibration session, then label every image against the agreed catalog.
How Much Training Data You Need
Data needs depend on the modeling approach, the number of defect classes, and how much the product naturally varies, so treat any fixed figure as a rough starting point. Transfer learning adapts a network already trained on a large general image collection, which can sharply cut the labeled examples required. Anomaly detection goes further by learning only what good parts look like and flagging anything unusual, which helps when real defects are rare.
Coverage matters more than raw count. Collect images across shifts, material lots, suppliers, and seasons, because a model trained on one week’s batch will struggle when conditions change. For rare defects, synthetic images or augmented copies (rotated, relit, or recolored) can fill gaps, though they should supplement real examples rather than replace them.
Choosing the Right Model Type
The right model type follows from the question the station needs to answer. A pass or fail call needs less than a measurement of flaw size against a tolerance. The table matches common types to their questions.
Model type
Classification
Question it answers
Is this part good or bad, and which class?
Good for
Simple pass or fail decisions
Model type
Object detection
Question it answers
Where is each flaw?
Good for
Multiple or small flaws, counting
Model type
Segmentation
Question it answers
Exactly which pixels are defective?
Good for
Measuring flaw size against a limit
Model type
Anomaly detection
Question it answers
Does this look different from normal?
Good for
Rare or unknown flaws, few labeled examples
Judge models with metrics that map to plant outcomes. Recall is the share of real defects the model catches, which drives escapes, while precision is the share of its rejects that are truly defective, which drives scrap of good parts. Training is iterative, so expect a first model, a round of errors flagged by the floor team, and a better second model trained on those errors.
Wondering how that cycle plays out on a high-variation material like fabric? Seeing a real project end to end often makes the data and labeling steps far more concrete. The Textile defect detection case study shows how this approach applies to a textile line.
Integrating Vision Inspection With Your Production Line
Integration means connecting the vision system to the equipment and software already running your line, chiefly the PLC that controls rejects, the MES or quality system that records results, and the network between them. This is where many computer vision manufacturing projects slow down. The model is software you control, while the line is a live system with safety interlocks, takt time, and maintenance windows.
Mounting and enclosure. Cameras and lights need rigid mounts, shielding from ambient light, and protection from dust, oil mist, and washdown.
Control signals. The station talks to the PLC over industrial protocols such as EtherNet/IP, PROFINET, or OPC UA.
Reject handling. The mechanism must remove the right part at line speed, with rejects going to a locked bin for review.
Data flow. Results and images feed the MES or quality system so statistical process control (SPC) charts and traceability stay complete.
Network and security. OT and IT teams agree on segmentation, remote access, and which images, if any, leave the plant.
Decide early what happens on failure. A station that silently passes everything when a camera cable works loose is worse than no station, because everyone assumes parts are being checked. A watchdog signal that stops the line or raises an alarm when images stop arriving is cheap insurance.
How to Calculate ROI for Computer Vision Manufacturing Projects
ROI for a vision inspection project comes from comparing the annual cost of the quality problems it addresses (escapes, scrap, rework, and inspection labor) against the full cost of building, integrating, and maintaining the system. Vendors often quote payback periods, but your own baseline numbers are the only ones that matter. Gather them first, because they also define what success looks like.
Cost side | Benefit side |
Cameras, optics, lighting, and enclosures | Fewer customer escapes, complaints, and warranty claims |
Edge compute hardware | Less scrap and rework from earlier detection |
Image collection and labeling time | Inspection labor moved to higher-value work |
Model development and line integration | Fewer stoppages from flawed parts reaching assembly |
Ongoing monitoring, retraining, and support | Image records that speed root cause analysis and audits |
A Worked Example
The arithmetic is simple once the inputs exist. The figures below are hypothetical and chosen only to make the math easy to follow. Replace every one of them with your own numbers.
Annual cost of visual defects today (escapes, scrap, rework): $400,000
Share of that cost the system removes: 50%, or $200,000
Inspection labor moved to other work: $60,000
Total annual benefit: $260,000
First-year cost (hardware, integration, model development): $250,000
Payback: about 11.5 months
Now rerun it with the system removing only 25% of the defect cost. Annual benefit falls to $160,000, and payback stretches to roughly 19 months. That sensitivity is the real lesson: your estimate of how much of the problem the system removes drives the whole case, so validate it in a pilot before committing to a plant-wide budget.
The Two Error Rates That Decide Your Payback
Two numbers decide whether a vision system pays off: the escape rate (defective parts it passes) and the false reject rate (good parts it rejects). They trade off, so tightening the confidence threshold catches more flaws but scraps more good parts. Set the threshold with production and finance in the room, because the right balance depends on whether an escape or a scrapped part costs you more.
What Computer Vision Cannot Do
Computer vision can only judge what a camera can see, so it is the wrong tool for internal flaws, surfaces hidden by geometry, and decisions that depend on touch, sound, or function. Knowing these limits upfront saves money and protects credibility with the floor team. Most computer vision manufacturing systems run into at least one of them during scoping.
Internal and subsurface flaws. Voids inside castings or delamination under coatings usually need X-ray, ultrasonic, or thermal methods.
Hidden surfaces. A face the camera cannot reach needs extra cameras, a part flip, or a robot, and each adds cost.
Reflective or transparent materials. Polished metal, glass, and clear plastics create glare that can hide flaws, and fixing it can take significant lighting work.
Brand-new flaw types. A supervised model knows only the classes it was trained on, so a new defect may pass unless anomaly detection is in the design.
Drift without upkeep. A new supplier, lamp, or raw material can erode accuracy gradually, and nobody notices without monitoring.
Functional judgment. Whether a part works, fits, or sounds right is a test question, not a vision question.
There is an economic limit as well. On a low-volume, high-mix line running a few hundred units of many variants, the data and retraining effort per variant can outweigh the savings. There, a well-lit manual station with digital image capture, or a vision assist that highlights areas for a person to check, may deliver much of the value at a fraction of the cost.
A Six-Phase Rollout Roadmap
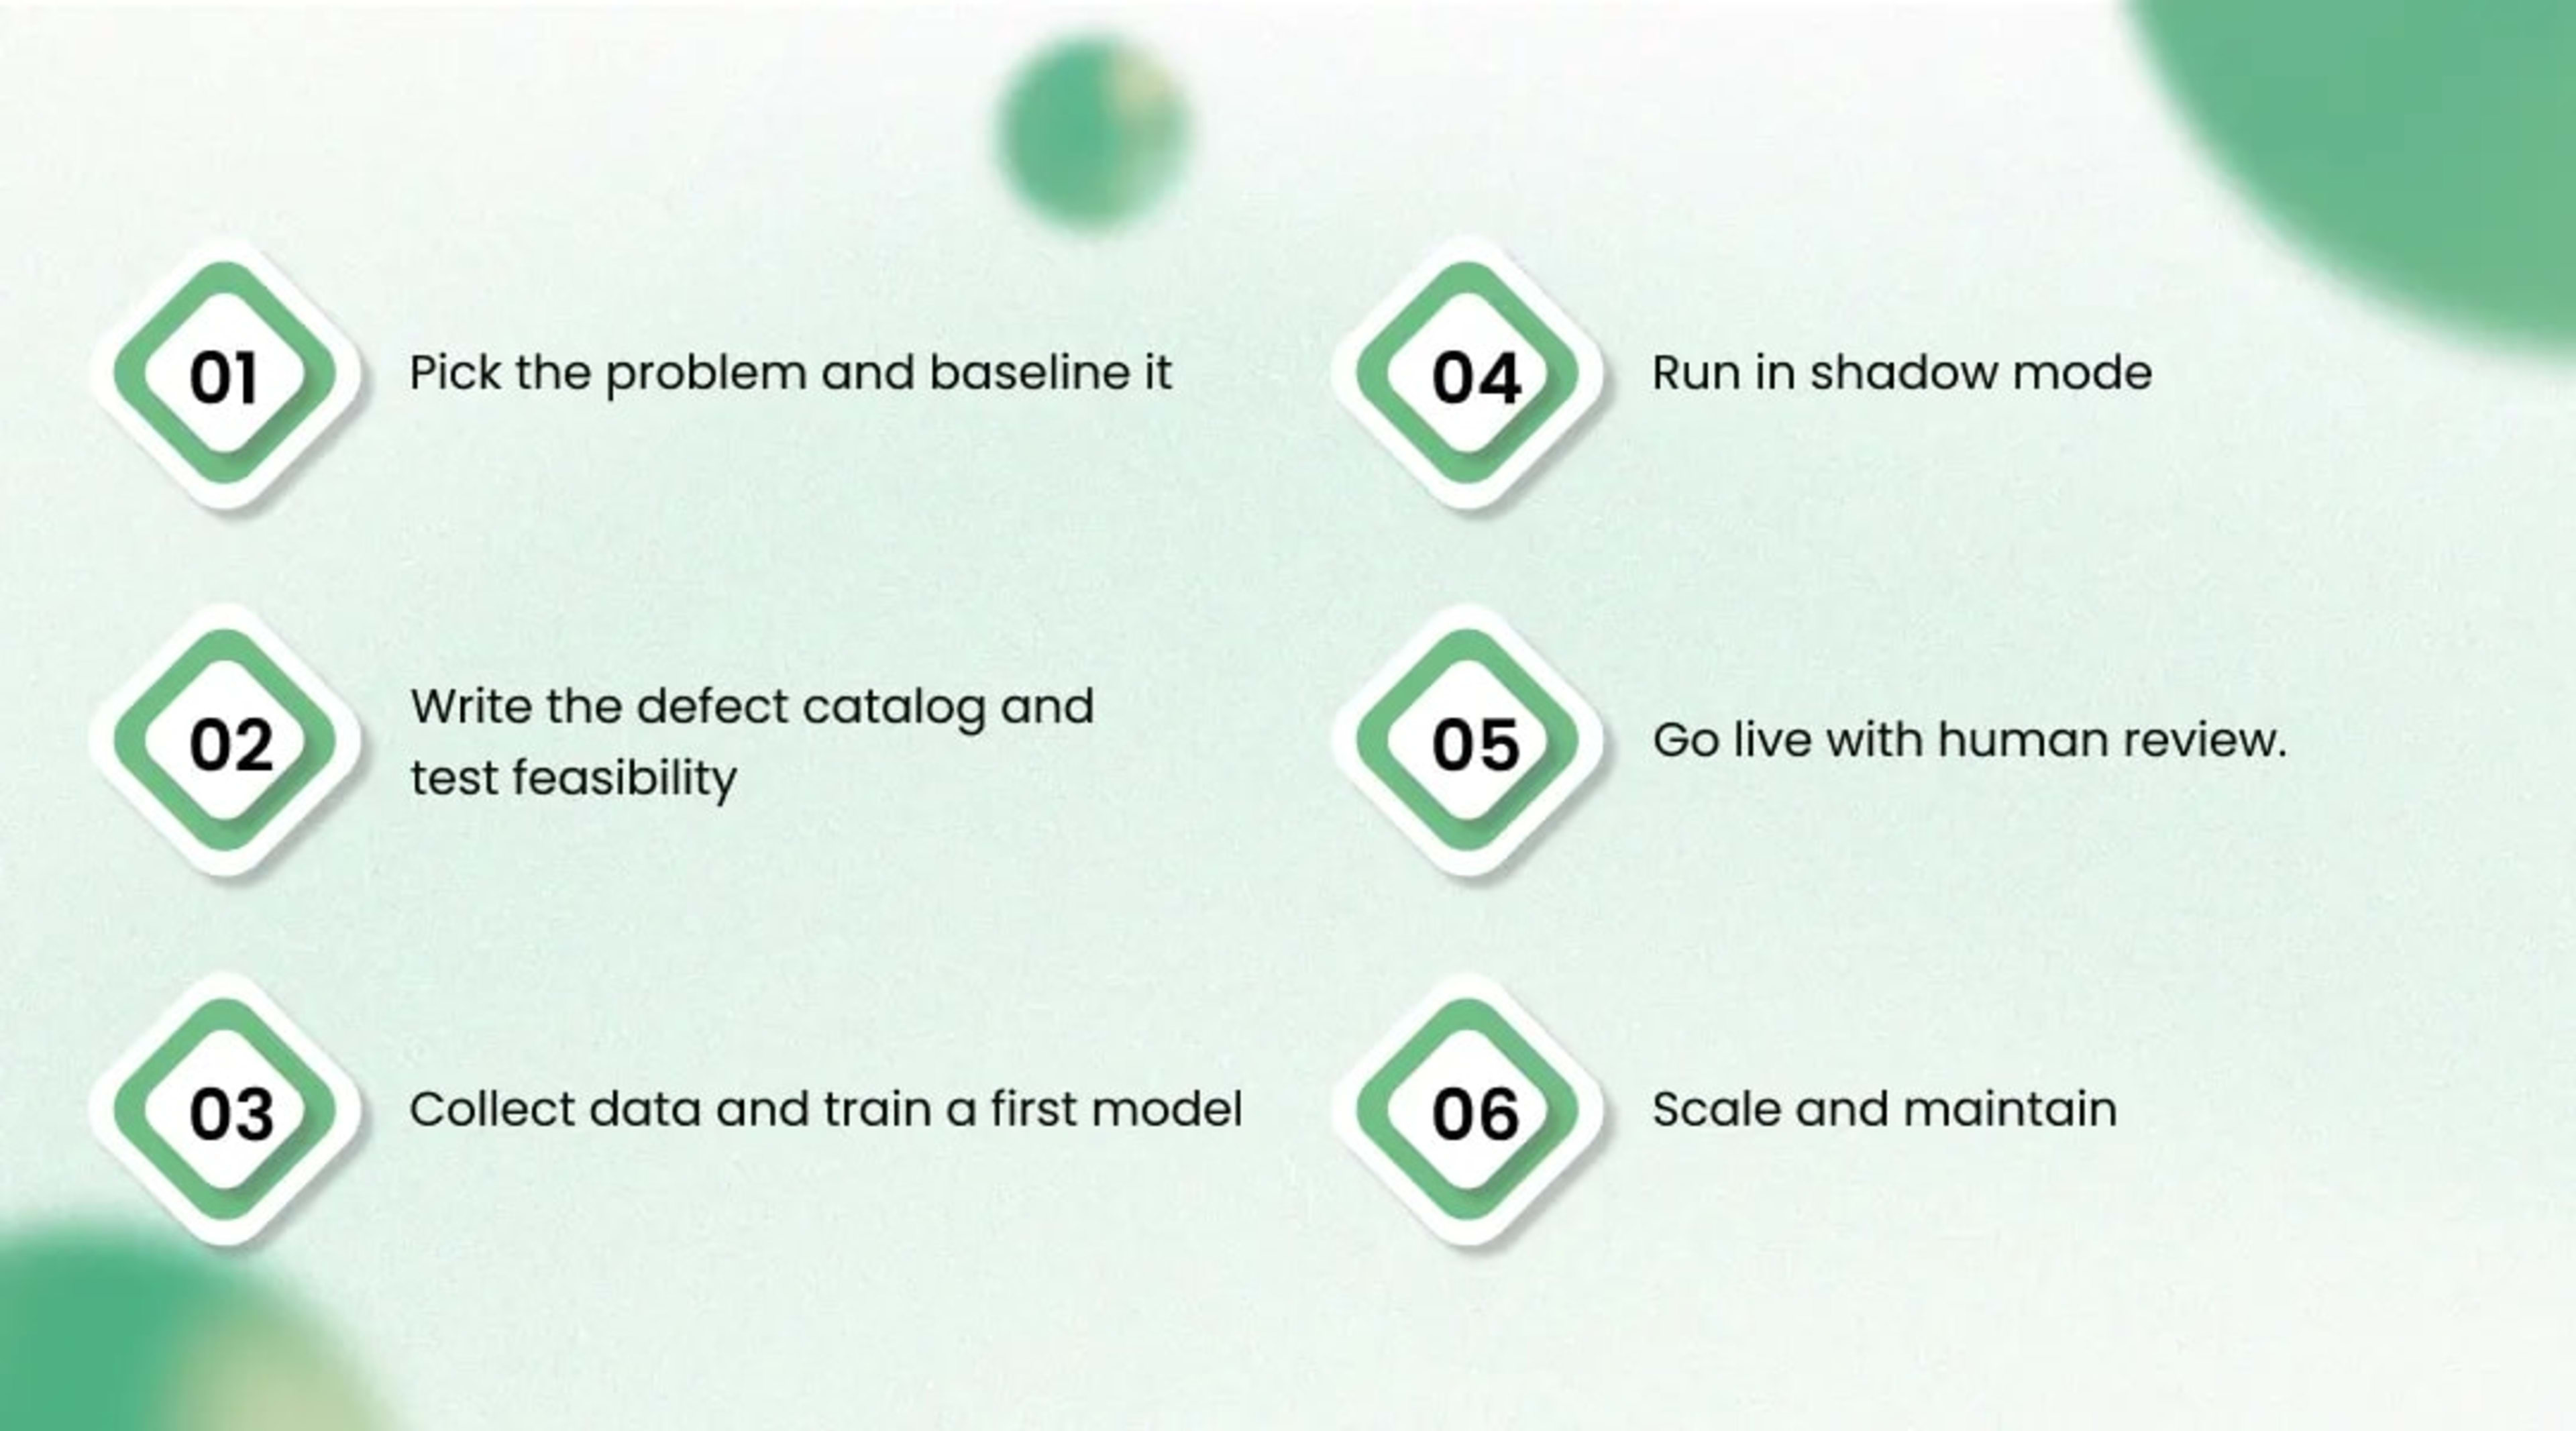
The safest way to roll out vision inspection is one line, one defect family, and one measurable problem at a time, with a go or no-go gate between phases. Plant-wide launches tend to stall because every line surfaces new lighting, data, and integration issues at once. Starting narrow keeps learning cheap and produces a reference station that later lines can copy.
Pick the problem and baseline it. Choose a line where a visual defect has a known cost, and record today’s escape rate, false reject rate, scrap, and inspection hours. Gate: an agreed numeric target.
Write the defect catalog and test feasibility. Capture sample images under trial lighting to confirm the flaws are visible at all. Gate: every target class shows clearly.
Collect data and train a first model. Capture images across shifts and lots, label against the catalog, and train. Gate: recall and precision on a held-out test set meet targets.
Run in shadow mode. The station records decisions while inspectors keep making the real call, and the two are compared. Gate: the system matches or beats manual results over a representative period.
Go live with human review. The system rejects automatically, sends low-confidence cases to a person, and passed parts are audited by sample. Gate: stable error rates and operator confidence.
Scale and maintain. Add drift monitoring, a retraining routine, and model version control, then reuse the design on the next line.
Shadow mode is the phase teams most want to skip and most regret skipping. It costs little, exposes edge cases the training data missed, and builds trust with operators who would otherwise treat the station as a black box. Treat it as non-negotiable for a first computer vision manufacturing deployment.
Who Owns the System After Go-Live
A vision station needs named owners after launch, because its accuracy depends on upkeep that otherwise falls between teams. Quality should own the defect catalog, thresholds, and review of uncertain cases, while maintenance owns cameras, lights, and the reject mechanism, including like-for-like lamp replacement. IT and OT own the network and security, and a data or engineering owner, internal or external, owns monitoring, retraining, and model versions.
Plants without in-house machine learning engineers often fill that last role with an outside partner, at least for the first year. That arrangement lets internal staff learn the system while someone experienced handles retraining and drift. If you are weighing that route, KriraAI’s Computer Vision Solutions page is one place to start the conversation.
Is AI Quality Control Right for Your Plant?
Automated visual inspection is a strong fit when flaws are visible, volumes are high, escapes are expensive, and the product varies too much for fixed rules, and it is a weak fit when any of those is missing. The signs below give a fair first read. They do not replace a feasibility test, but they filter out projects unlikely to pay back.
Signs You Are Ready
High volume where full inspection is required or clearly valuable
Flaws on surfaces a camera can reach
An escape, scrap, or labor cost you can already quantify
Someone willing to own the system after launch
Signs to Wait
Flaws that are mostly internal or functional
Very low volume with frequent changeovers
No agreed definition of what counts as a defect
No budget or owner for ongoing maintenance
If the warning signs outnumber the good ones, wait. Fixing the defect definition, adding image capture at a manual station, or stabilizing lighting first can make a later project far cheaper and more likely to succeed. Forcing a vision system onto an unready line is a reliable way to end up with an abandoned pilot.
Start With One Line and One Defect
The fastest route to value is a narrow, measurable first project that proves the economics on your own line before you scale. Pick the defect that costs you most, record your baseline, and test whether a camera can see it clearly. Those three steps answer most of the questions a full proposal would raise.
Once that baseline exists, a feasibility review becomes a short, concrete exercise rather than an open-ended study. Teams that want help scoping, building, and integrating a station can explore KriraAI’s AI visual inspection services and bring their numbers to the first conversation. A clear baseline makes every later decision, from camera choice to ROI sign-off, faster and easier to defend.
FAQs
Computer vision in manufacturing is the use of cameras and AI models to interpret images of products and processes so machines can make visual judgments automatically. Its most common job is quality inspection. Plants also use it for assembly checks, label reading, and safety monitoring.
Machine vision traditionally means camera systems that inspect parts using programmed rules and templates. Computer vision, in the factory sense, usually means deep learning models that learn what to look for from labeled examples. Many modern stations combine both.
Accuracy depends on the defect type, lighting, image quality, and training data, so no single figure fits every line. As a reference point, Sandia National Laboratories put the industry average hit rate for human visual inspection at about 80%. Measure any vision system against your own baseline in shadow mode before go-live.
It can, if your current cameras and lighting produce clear, consistent images in which the target flaws are visible. Lighting is the more frequent gap, though older low-resolution cameras may also need replacing. A short feasibility test with sample images settles the question before you commit budget.
A supervised model recognizes only the defect classes it was trained on, so a genuinely new flaw may pass. Anomaly detection models address this by learning what normal parts look like and flagging anything unusual. Many production systems pair the two.
A well-designed station sends a watchdog signal to the PLC, so a camera or software failure stops the line or diverts parts to manual checks. The worst design silently passes every part after it fails. This failure behavior belongs in the integration specification.
Yes, if each variant is represented in the training data and the station knows which variant is running, usually through a recipe signal from the PLC or MES. Similar products can often share one model. Very different products may need separate models and more validation.
Retraining frequency depends on process stability, since new suppliers, materials, and lighting all cause drift. Stable lines may need only occasional updates. Drift monitoring lets you retrain when accuracy actually drops rather than on a fixed calendar.
In most implementations it changes the inspector’s role rather than removing it. People review uncertain cases, audit passed parts, maintain the defect catalog, and use image records for root cause work. The repetitive looking moves to the machine.
Cost depends on camera count, lighting complexity, compute hardware, integration effort, and how much data collection and labeling the defects need. A single station checking one flaw family costs far less than a multi-camera cell inspecting complex parts from every angle. Budget for ongoing monitoring and retraining alongside the upfront price.
Founder & CEO
Divyang Mandani is the CEO of KriraAI, driving innovative AI and IT solutions with a focus on transformative technology, ethical AI, and impactful digital strategies for businesses worldwide.