Every data science services company sells speed, accuracy, and insight. Yet one of our data science services clients discovered that its own internal operations contradicted every promise it made to its customers. With a team of 85 data scientists and ML engineers spread across fourteen active client engagements, the firm was spending an average of 23 days moving a validated model from a Jupyter notebook into a production API endpoint. Nearly 40% of senior data scientist time was consumed not by modeling or feature engineering but by infrastructure wrangling, environment debugging, and manual deployment coordination. The firm's leadership recognized a painful irony: they were advising Fortune 500 companies on AI transformation while running their own ML lifecycle on duct tape and tribal knowledge.
KriraAI was engaged to design and deliver a comprehensive AI solution for data science service operations, one that would replace the fragmented, manual, and error-prone ML lifecycle with a unified automated platform capable of handling everything from experiment tracking through production model serving and monitoring. This blog walks through the complete story of that engagement: the operational reality we walked into, the platform we designed, the architecture we built layer by layer, the implementation challenges we navigated, and the measurable results the client achieved within the first six months of going live.
The client's core business was delivering custom machine learning solutions to enterprises across financial services, healthcare, and retail. Each engagement followed a broadly similar lifecycle: ingest client data, explore and clean it, engineer features, train and validate models, deploy them into production, and monitor their ongoing performance. The problem was not in any single step. The problem was that every step existed as an isolated activity performed differently by every team, on every project, with almost no shared infrastructure, no standardized tooling, and no reproducibility guarantees.
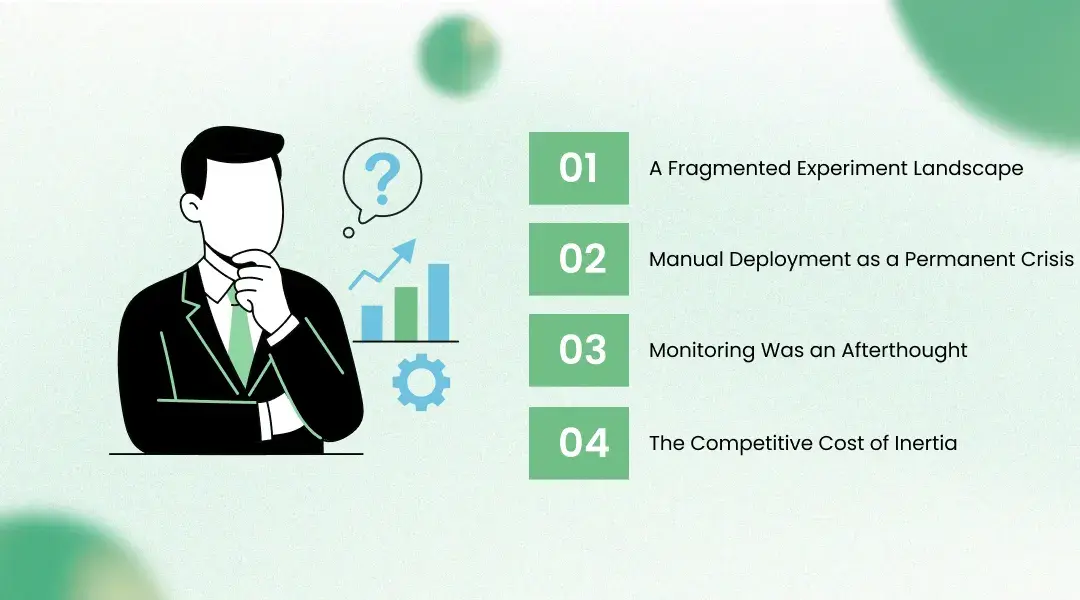
Data scientists were running experiments in personal Jupyter notebooks stored on local machines or in ad hoc S3 buckets with no consistent naming convention. Experiment tracking was handled through a mixture of spreadsheets, Slack messages, and README files committed sporadically to Git repositories. When a project lead needed to review which hyperparameter configuration produced the best validation score three weeks earlier, the answer often required interrupting the data scientist who ran the experiment and hoping they could locate the right notebook. Model versioning was effectively nonexistent. The firm had experienced at least three incidents in the preceding year where a model deployed to production was not the model that had been validated during review, because the wrong artifact had been picked up from an unversioned storage location.
Deploying a model into production was the single most painful phase of every engagement. The firm had no standardized serving infrastructure. Some models were served behind Flask APIs running on EC2 instances provisioned manually. Others were deployed as AWS Lambda functions with packaging scripts that each data scientist had written independently. A few older engagements still ran models inside cron-triggered batch scripts on bare metal servers in a colocation facility. Every deployment required a different set of steps, a different set of dependencies, and a different person who understood how that particular stack worked. When that person was on leave or had rotated to another project, deployments stalled. The average time from model validation sign-off to production readiness was 23 days, with a standard deviation of 11 days, meaning some deployments took over a month.
Once a model reached production, monitoring was minimal at best. The firm had no systematic data drift detection, no automated performance tracking against ground truth, and no alerting infrastructure. Model degradation was typically discovered when a client complained about declining prediction quality, sometimes weeks or months after the degradation had begun. Retraining was entirely reactive and manual. A senior engineer estimated that at least 30% of their production models were performing below their validated accuracy thresholds at any given time, but without monitoring, no one could confirm or deny that estimate with data.
The firm was losing competitive bids to smaller, more agile competitors who could promise faster time to production and continuous model improvement as part of their service agreements. Two significant contract renewals had been at risk in the previous quarter because clients questioned why model updates took weeks instead of days. The leadership team understood that the problem was not talent. Their data scientists were exceptional. The problem was that exceptional data scientists were spending their time on undifferentiated infrastructure work instead of the high-value modeling and analysis that clients were actually paying for.
KriraAI designed and delivered an end-to-end automated ML pipeline platform that unified the entire machine learning lifecycle into a single, standardized, and highly automated system. The platform replaced the patchwork of notebooks, scripts, and manual processes with a production-grade infrastructure layer that every team could use across every client engagement without sacrificing the flexibility that individual projects required.
The platform operates across four functional domains. The first is experiment management, where data scientists define, execute, track, and compare experiments using a structured interface that automatically captures every parameter, metric, dataset version, and artifact. The second is pipeline orchestration, where feature engineering, training, validation, and evaluation steps are defined as composable, versioned pipeline stages that execute reproducibly in containerized environments. The third is model serving, where validated models are packaged, deployed, and served through a standardized inference infrastructure that supports both real-time and batch prediction patterns with automatic scaling. The fourth is production monitoring, where deployed models are continuously evaluated against incoming data distributions and prediction quality metrics, with automated alerting and retraining triggers.
At the AI and ML core, KriraAI built a meta-learning layer that accelerates the platform's own operations. A transformer-based encoder model, fine-tuned on the firm's historical experiment metadata, provides intelligent suggestions for hyperparameter search spaces and feature selection strategies based on dataset characteristics and task type. This meta-learning component was trained using supervised fine-tuning on a curated corpus of over 2,800 completed experiments from the firm's prior engagements, with contrastive learning applied to generate embedding representations of dataset profiles that enable similarity-based retrieval of relevant past experiment configurations. The system does not make autonomous modeling decisions. It surfaces ranked suggestions to the data scientist, who retains full control. However, it reduces the cold-start time on new engagements by providing an informed starting point grounded in the firm's own accumulated experience.
The platform also includes a natural language interface built on a retrieval augmented generation pipeline. Data scientists and project leads can query the platform conversationally to ask questions such as "which feature engineering approach produced the highest AUC on the last three credit scoring projects" or "show me the drift metrics for all models deployed to Client X in the last 90 days." The RAG pipeline retrieves relevant records from the platform's metadata store, constructs a context window, and generates precise, cited answers using a fine-tuned large language model. This interface dramatically reduced the time spent searching for institutional knowledge and past project decisions.
The architecture of this AI solution for data science service delivery was designed for three non-negotiable properties: reproducibility across every experiment and deployment, automation of every step that does not require human judgment, and extensibility so that new model types, serving patterns, and data sources can be added without architectural changes. KriraAI approached the architecture as a platform engineering problem, not a data science problem, because the firm's data science capabilities were already strong. What they lacked was the platform beneath those capabilities.
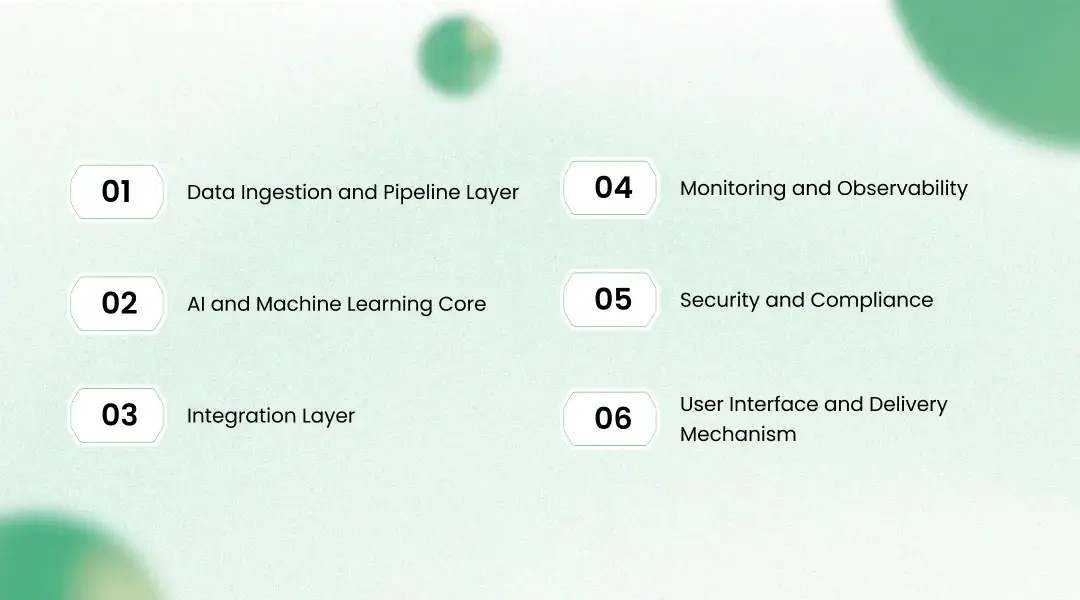
The data ingestion layer handles two categories of data. The first is client engagement data, which arrives in diverse formats from client environments including relational databases via change data capture using Debezium, flat file drops to cloud storage, event streams from client Kafka topics, and API-based extraction from enterprise systems such as Salesforce, SAP, and Snowflake. The second is platform operational data, which includes experiment metadata, pipeline execution logs, model artifacts, serving metrics, and monitoring signals generated by the platform itself.
All ingested data passes through a schema normalization service built on Apache Flink, which performs real-time validation, type coercion, and entity resolution before writing to a unified data lake on Amazon S3 with Apache Iceberg as the table format. Iceberg was chosen specifically for its time-travel capabilities, which allow any experiment or pipeline run to be reproduced against the exact data state that existed at execution time. Pipeline orchestration is managed by Dagster, which provides a strongly typed, asset-oriented DAG framework. Each pipeline stage is defined as a software-defined asset with explicit dependencies, materializations, and quality checks. Dagster was selected over Airflow after evaluating both in a two-week spike, primarily because its asset-centric model aligned more naturally with ML pipeline semantics where intermediate artifacts such as feature sets and trained model weights are first-class entities rather than side effects of task execution.
The ML core is structured around three subsystems. The experiment engine provides a standardized execution environment where every training run executes inside a versioned Docker container with pinned dependency manifests. MLflow serves as the experiment tracking and model registry backbone, with custom extensions KriraAI built to enforce artifact signing and lineage tagging. Every model artifact is stored with a cryptographic hash of its training data, configuration, and code snapshot, ensuring full provenance traceability.
The meta-learning recommender operates as an independent microservice. It uses a transformer encoder with 12 attention heads and 6 layers, trained on structured experiment metadata represented as tabular token sequences. Input features include dataset dimensionality, feature type distributions, target variable characteristics, domain category, and task type. The model generates ranked recommendations for hyperparameter search spaces, preprocessing strategies, and model family selection. Embedding alignment between dataset profiles and historical experiment outcomes was achieved through a contrastive learning objective using InfoNCE loss, with hard negative mining from experiments that shared surface-level similarity but diverged in outcome.
The RAG subsystem uses a fine-tuned Mistral 7B model served via vLLM with continuous batching and PagedAttention for efficient GPU memory utilization. Document retrieval operates over a Qdrant vector database indexed using HNSW with 64 neighbors and ef_construction of 200, storing embeddings of experiment records, pipeline configurations, deployment logs, and project documentation. Embedding generation uses a sentence-transformer model fine-tuned on the firm's internal technical vocabulary to ensure high retrieval precision on domain-specific queries.
The platform integrates with client environments and internal systems through an event-driven architecture built on Apache Kafka. Model serving events, deployment status changes, monitoring alerts, and pipeline completions are published as structured events to Kafka topics, which downstream consumers subscribe to based on their needs. Client-facing model APIs are exposed through an API gateway built on Kong, which handles authentication, rate limiting, request routing, and version management. Internal service communication between platform components uses gRPC for low-latency, type-safe interactions, with Protocol Buffers defining service contracts that are versioned and backward-compatible. Webhook-based integrations connect platform events to external systems including Jira for automatic ticket creation when model performance degrades, Slack for team notifications, and client-specific business systems that consume prediction outputs.
Monitoring operates at three levels. Infrastructure monitoring uses Prometheus and Grafana to track compute utilization, container health, and network metrics across the platform's Kubernetes cluster. Model performance monitoring runs on a custom-built evaluation service that continuously compares production predictions against delayed ground truth labels, computing metrics such as AUC, F1, RMSE, and calibration error on rolling windows. Data drift detection uses a combination of population stability index for categorical features and Kolmogorov-Smirnov tests for continuous features, with alerts triggered when drift scores exceed thresholds calibrated during model validation. Latency tracking is instrumented at p50, p95, and p99 percentiles for every inference endpoint, with automatic scaling triggers tied to p95 latency breaching SLA thresholds. Automated retraining pipelines are triggered when performance metrics cross degradation thresholds, executing the full training pipeline with the latest data and promoting the new model only after it passes a suite of validation gates.
The platform is deployed within a private VPC with no public-facing endpoints except the API gateway, which terminates TLS and enforces mutual authentication for client connections. Role-based access control is implemented at the platform level with attribute-level data masking, ensuring that data scientists working on one client engagement cannot access data or artifacts from another engagement without explicit authorization. All model inputs and outputs are encrypted in transit using TLS 1.3 and at rest using AES-256. Audit logging writes to an immutable append-only store on Amazon S3 with object lock enabled, providing a tamper-proof record of every data access, model training run, deployment action, and configuration change. The platform was designed to support SOC 2 Type II compliance requirements, and KriraAI worked with the client's compliance team to ensure that all data handling procedures met the contractual obligations of their enterprise clients in regulated industries.
The platform's primary interface is a web application built with React and backed by a FastAPI service layer. Data scientists interact with the platform through both the web UI for experiment management, pipeline configuration, and monitoring dashboards, and through a CLI tool for programmatic pipeline execution and integration with existing notebook workflows. The natural language query interface is embedded within the web application as a conversational panel, allowing users to ask questions about experiments, deployments, and monitoring data without leaving their workflow context. Project leads and client stakeholders access a separate read-only dashboard that surfaces key metrics including model performance trends, deployment status, and SLA compliance without exposing internal platform details.
The technology stack was selected through a structured evaluation process that KriraAI conducts on every engagement. Each technology was assessed against four criteria: fitness for the specific workload, operational maturity in production environments, compatibility with the client's existing infrastructure, and total cost of ownership over a three-year horizon.
Dagster was chosen for pipeline orchestration because its asset-oriented model treats ML artifacts as first-class citizens, unlike task-oriented frameworks that require workarounds to track intermediate outputs.
Apache Flink was selected for stream processing because the client needed real-time schema validation with exactly-once processing guarantees, which Flink provides natively.
Apache Iceberg was adopted as the table format because its snapshot isolation and time-travel capabilities are essential for experiment reproducibility in a multi-tenant data lake.
MLflow serves as the experiment tracker and model registry because of its broad ecosystem compatibility and because the client's data scientists were already familiar with its interface, reducing adoption friction.
vLLM was chosen for LLM serving because its PagedAttention mechanism delivers significantly higher throughput per GPU compared to standard HuggingFace inference, which was critical given the platform's query volume.
Qdrant was selected as the vector database because it offers strong HNSW indexing performance with native filtering support, which was necessary for scoping retrieval queries to specific projects or time ranges.
Kubernetes on AWS EKS provides the compute orchestration layer, chosen for its auto-scaling capabilities and the client's existing AWS footprint.
Kong serves as the API gateway because it supports plugin-based extensibility for authentication, rate limiting, and observability without vendor lock-in.
The engagement spanned 22 weeks from the initial discovery session to production launch. KriraAI structured the delivery into six phases, each with defined entry criteria, deliverables, and review gates.
KriraAI embedded two senior engineers with the client's team for three weeks to map every existing workflow, catalog every tool in use, interview team leads from each active engagement, and document the pain points in granular detail. This phase produced a 47-page technical assessment that became the foundation for all architectural decisions. The most important finding was that the client's teams had developed at least nine distinct deployment patterns across their engagements, none of which were documented, and several of which contained hardcoded credentials and environment-specific configurations that would break if moved to any other infrastructure.
The architecture was designed collaboratively between KriraAI's platform engineering team and the client's senior technical staff. KriraAI presented three architecture options at different levels of automation and complexity. The client selected the most comprehensive option after evaluating the long-term cost of maintaining less automated alternatives. Every architectural decision was documented in an Architecture Decision Record format, ensuring that future engineers could understand not just what was built but why each choice was made.
Development followed a two-week sprint cadence with continuous integration and deployment to a staging environment. KriraAI's team of six engineers worked alongside three engineers from the client's platform team to ensure knowledge transfer happened throughout development rather than as a post-delivery afterthought. The most significant challenge during development was data quality in the historical experiment metadata used to train the meta-learning recommender. Nearly 35% of historical experiment records lacked complete hyperparameter logs, and 12% contained inconsistent metric definitions across projects. KriraAI invested two additional weeks in building a data reconciliation pipeline that standardized historical records, imputed missing metadata where possible using code repository analysis, and flagged irrecoverable records for exclusion from the training set.
A second major challenge arose during integration with the client's existing Git-based workflow. Data scientists had strong preferences for their notebook-first workflow and initially resisted the structured pipeline approach. KriraAI addressed this by building a notebook-to-pipeline bridge that allowed data scientists to continue working in notebooks during experimentation, then convert validated notebooks into pipeline stages with a single CLI command. This bridge preserved the exploratory flexibility that data scientists valued while ensuring that anything moving toward production entered the standardized pipeline framework.
The platform underwent three rounds of validation. The first was a technical validation where KriraAI replicated five completed client engagements end to end on the new platform, verifying that every model could be reproduced within acceptable tolerance. The second was a user acceptance testing phase where data scientists from four project teams used the platform on active engagements while providing daily feedback. The third was a load test simulating 3x the client's current concurrent workload to validate scaling behavior. Production launch was executed as a phased rollout, with two project teams migrating in the first week, four more in the second week, and the remaining teams transitioning over the following month.
The measurable outcomes were tracked over the first six months following full production deployment, and the numbers validated the entire engagement thesis.
Model deployment time dropped from 23 days to 6 days on average, a 74% reduction, with the fastest deployments completing in under 48 hours for model types the platform had previously processed.
Data scientist time spent on infrastructure tasks fell from 40% to under 12%, freeing approximately 1,400 hours per month of senior talent capacity that was redirected to billable client work.
Production model incidents caused by deployment errors dropped by 89%, from an average of 4.2 per month to 0.5 per month, because the standardized pipeline eliminated the manual configuration steps where errors previously occurred.
Model retraining cycle time decreased from an average of 14 days to 3 days, with automated drift detection triggering retraining before clients reported quality issues rather than after.
The meta-learning recommender reduced experiment cold-start time by 31% on new engagements, measured as the time from project kickoff to first validated model candidate.
Client satisfaction scores on post-engagement surveys improved by 18 percentage points, with specific gains in responsiveness and model update turnaround.
The firm estimated that the platform's efficiency gains contributed to approximately $2.1 million in recovered revenue capacity in the first year, calculated from the reallocation of senior data scientist hours from infrastructure work to billable modeling engagements.
The platform was deliberately designed as an extensible foundation rather than a closed system. The asset-oriented pipeline architecture means that new model types, data sources, and serving patterns can be added as new pipeline stages without modifying the core platform. The client's technical roadmap, developed collaboratively with KriraAI during the final phase of the engagement, includes three major extensions planned for the next 24 months.
The first is a federated learning capability that will allow the platform to train models across client data silos without centralizing sensitive data, which is particularly relevant for the firm's healthcare and financial services engagements where data residency requirements are strict. The second is an automated model documentation generator that uses the RAG pipeline to produce model cards, validation reports, and regulatory documentation by querying the platform's metadata store, reducing the documentation burden that currently consumes significant time on regulated industry engagements. The third is a real-time feature store with both online and offline serving paths, built on Apache Kafka and Redis, that will enable the platform to support low-latency feature serving for real-time prediction use cases that the firm is increasingly asked to deliver.
Other data science services firms facing similar operational challenges can draw a clear lesson from this engagement. The bottleneck in most data science organizations is not modeling capability. It is the absence of platform infrastructure that makes modeling capability repeatable, reliable, and fast. Investing in ML pipeline automation and enterprise MLOps architecture is not a luxury. It is the operational foundation that separates firms that can deliver at enterprise scale from those that cannot.
Three insights from this engagement stand out above the rest. The technical insight is that the most impactful architectural decision was treating ML artifacts as first-class assets rather than side effects of pipeline tasks, which is why Dagster's asset-oriented model proved so much more natural for ML workflows than traditional task-oriented orchestrators. The operational insight is that the deployment bottleneck in data science organizations is almost never a talent problem. It is a platform problem, and solving it unlocks capacity that was always present but trapped under infrastructure overhead. The strategic insight is that data science services firms competing for enterprise contracts must demonstrate operational maturity in their own ML lifecycle, because enterprise clients increasingly evaluate not just model quality but the reliability, reproducibility, and governance of the delivery infrastructure behind those models.
KriraAI brings this same level of engineering rigor and delivery discipline to every client engagement, whether the challenge involves building ML platforms, deploying computer vision systems, implementing NLP pipelines, or designing AI-driven decision automation. Our team of senior AI engineers, platform architects, and MLOps specialists works as an embedded extension of our clients' technical teams, ensuring that knowledge transfer and operational ownership are built into every phase of delivery. If your organization is facing an AI implementation challenge that demands production-grade engineering rather than proof-of-concept experimentation, we invite you to start a conversation with KriraAI about what a well-architected AI solution for data science service delivery can look like in your environment.
An automated ML pipeline platform improves data science service delivery by eliminating the manual, error-prone steps that consume disproportionate time between model development and production deployment. In the engagement described in this blog, the platform standardized experiment tracking, containerized training execution, automated model packaging and deployment, and implemented continuous monitoring with drift detection. This meant that data scientists spent their time on the high-value analytical work that clients pay for rather than on infrastructure configuration, dependency management, and deployment scripting. The result was a 74% reduction in deployment time and a measurable shift in senior talent utilization from infrastructure tasks to billable modeling work, which directly improved both delivery speed and revenue capacity for the firm.
KriraAI does not recommend a single fixed technology stack for enterprise MLOps because the right choices depend on the client's existing infrastructure, workload characteristics, team skills, and compliance requirements. However, in this engagement the stack included Dagster for asset-oriented pipeline orchestration, Apache Flink for real-time data validation, MLflow for experiment tracking and model registry, vLLM for high-throughput LLM serving, Qdrant for vector search, Kubernetes on AWS EKS for compute orchestration, and Prometheus with Grafana for infrastructure monitoring. Each technology was selected through a structured evaluation against four criteria: workload fitness, operational maturity, infrastructure compatibility, and three-year total cost of ownership. The key principle is that every technology choice should have a documented engineering rationale, not just familiarity or popularity.
The implementation timeline for an AI solution for data science service operations depends on the scope of automation, the complexity of existing workflows, and the state of historical data. In this engagement, KriraAI delivered the complete platform in 22 weeks from initial discovery to production launch, with six defined phases covering discovery, architecture design, development, integration, testing, and phased rollout. The most time-intensive aspects were not the core platform development but the data reconciliation work required to standardize inconsistent historical experiment metadata and the user adoption work required to design a workflow bridge that preserved data scientist flexibility while enforcing pipeline standardization. Organizations with cleaner historical data and more standardized existing workflows may see shorter timelines, while those with more technical debt should plan for additional reconciliation effort.
Production machine learning models in a services environment require monitoring at three distinct levels. Infrastructure monitoring tracks compute utilization, container health, and network performance using tools like Prometheus and Grafana. Model performance monitoring continuously compares production predictions against delayed ground truth labels, computing task-specific metrics on rolling windows and alerting when accuracy or calibration degrades beyond validated thresholds. Data drift detection monitors incoming feature distributions using statistical tests such as population stability index for categorical variables and Kolmogorov-Smirnov tests for continuous variables, detecting distributional shifts that predict future performance degradation before it manifests in output quality. In a services environment where multiple client models run simultaneously, monitoring must also enforce isolation so that one client's data and performance metrics are never visible to another client's team.
KriraAI implements a defense-in-depth security model for multi-client AI platforms that addresses data isolation, access control, encryption, and auditability. In this engagement, the platform was deployed within a private VPC with no public-facing endpoints except the API gateway, which enforced mutual TLS authentication. Role-based access control with attribute-level data masking ensured that data scientists could only access data and artifacts from engagements they were explicitly authorized to work on. All data was encrypted in transit using TLS 1.3 and at rest using AES-256. Every data access, model training run, and deployment action was recorded in an immutable append-only audit log with object lock enabled, providing a tamper-proof compliance record. The platform was designed to support SOC 2 Type II compliance requirements, which was essential given the client's enterprise customers in regulated industries including healthcare and financial services.
Ridham Chovatiya is the COO at KriraAI, driving operational excellence and scalable AI solutions. He specialises in building high-performance teams and delivering impactful, customer-centric technology strategies.