The average auto parts manufacturer loses between 3% and 5% of annual revenue to quality related defects. For a mid sized factory producing 15,000 components daily, that translates to roughly $2.1 million in scrap, rework, and warranty claims every year. These are not abstract numbers. They represent real margin erosion in an industry where profit margins already hover around 5% to 7%. When one Tier 2 auto parts supplier in Pune, India decided to deploy AI powered quality checks across its production lines, the results were not incremental. Within nine months, the factory eliminated 200 manual visual inspections per day, reduced its defect escape rate by 87%, and saved over $1.4 million annually in quality related costs. This case study walks through exactly how that transformation happened, from the initial problem assessment and technology selection to the deployment challenges and measurable outcomes that followed.
Rajesh Auto Components (name changed for confidentiality) operates a 60,000 square foot manufacturing facility producing brake disc assemblies, suspension brackets, and engine mounting components for three major OEMs. Before the AI implementation, their quality assurance process relied entirely on human visual inspection at four stages of production: raw material intake, post machining, post heat treatment, and final assembly.
Each inspection station was staffed by two trained inspectors working in rotating 8 hour shifts. These inspectors evaluated components for surface cracks, dimensional deviations, porosity, burrs, and coating inconsistencies. On a typical production day, the factory processed approximately 15,000 individual components, requiring over 200 discrete quality checks across all four stations. The inspectors were skilled and experienced, with an average tenure of 11 years on the shop floor.
Despite their expertise, the system had fundamental limitations. Human visual inspection accuracy for surface defects on machined metal parts typically ranges between 75% and 85%, depending on lighting conditions, inspector fatigue, and the subtlety of the defect. At Rajesh Auto Components, internal audits revealed that inspectors were catching about 78% of defects during the first pass, with roughly 22% of defective components reaching the next production stage or, worse, shipping to the OEM customer.
The cost of these escapes was significant. Warranty claims from OEM customers had increased by 34% over two years. One major client had issued a formal quality warning letter, threatening to reduce order volumes by 40% if the defect rate did not improve within six months. The factory was also spending approximately $380,000 annually on rework alone, not counting the scrap costs for components that could not be salvaged.
The quality team had attempted to address the problem through conventional means. They increased inspection time per component, added a fifth inspection point, and implemented statistical process control charts. None of these interventions produced a meaningful reduction in defect escape rates. The core problem was biological: human eyes fatigue, attention drifts, and subtle defects on high volume production lines simply escape detection at rates that modern OEM quality standards no longer tolerate.
The limitations at Rajesh Auto Components were not unique. They reflected systemic challenges across the auto parts manufacturing sector that make traditional quality assurance increasingly inadequate.
Auto parts production lines operate at cycle times measured in seconds. A typical CNC machining centre at this factory completed one brake disc every 42 seconds. Inspectors had approximately 15 to 20 seconds per component to evaluate surface quality, dimensional conformance, and structural integrity. This created an inherent tension between throughput and inspection thoroughness that no amount of training could resolve. When production managers pushed for faster throughput to meet OEM delivery schedules, inspection accuracy dropped further. Internal data showed a direct correlation: for every 10% increase in line speed, defect escape rates rose by approximately 6%.
Even the best human inspectors exhibit significant variation in detection accuracy across a single shift. Studies in manufacturing ergonomics show that visual inspection accuracy degrades by 15% to 25% after the fourth consecutive hour of repetitive inspection tasks. At Rajesh Auto Components, defect escape data from their MES (Manufacturing Execution System) confirmed this pattern. Components inspected during the last two hours of each shift had a defect escape rate nearly double that of components inspected during the first two hours. This was not a personnel problem. It was a human physiology problem, and no amount of performance management could eliminate it.
Manual inspection also created a data desert. Inspectors recorded pass or fail decisions on paper checklists, with occasional notes about defect type and location. This data was neither granular enough nor structured enough to support root cause analysis. When a batch of 500 brake discs showed elevated porosity rates, the quality team could identify that porosity was the issue but could not correlate it to specific machine parameters, raw material batches, or environmental conditions. The absence of structured, machine readable quality data meant that the factory was perpetually reactive, fixing defects after they occurred rather than predicting and preventing them.
The tipping point came in March 2024 when the factory's largest OEM client, accounting for 45% of revenue, formally escalated their quality concerns to a Supplier Corrective Action Request (SCAR). The SCAR required Rajesh Auto Components to demonstrate a measurable improvement plan within 90 days or face a 12 month probationary status that would effectively freeze new business awards.
The factory's managing director assembled a cross functional team including the quality head, production manager, IT lead, and an external consultant from KriraAI, a company that specialises in building practical AI solutions for manufacturing enterprises. KriraAI's team conducted a two week assessment of the factory's quality processes, data infrastructure, and production environment to determine whether AI powered inspection was technically feasible and economically justified.
The assessment revealed three critical findings. First, approximately 85% of the defects that escaped detection were surface level anomalies (cracks, porosity, burrs) that are well suited to computer vision based detection. Second, the factory's existing camera infrastructure at two of the four inspection stations could be upgraded rather than replaced, reducing initial capital expenditure. Third, the ROI calculation showed a payback period of approximately 14 months, assuming a conservative 60% reduction in defect escapes.

The solution deployed at Rajesh Auto Components was a computer vision system built on deep learning models trained specifically for auto parts defect detection. Unlike generic machine vision systems that rely on rule based algorithms with predefined defect templates, the AI system used convolutional neural networks (CNNs) that learned to identify defects from labelled training data.
The physical setup involved industrial grade cameras, lighting rigs, and edge computing devices at each of the four inspection stations. The hardware components included high resolution area scan cameras (12 megapixel) with telecentric lenses to minimise perspective distortion on cylindrical and flat machined surfaces. Structured LED lighting arrays were designed to maximise surface defect visibility through controlled angle illumination. NVIDIA Jetson based edge computing units at each station handled inference processing locally, and a central server running the model management platform handled retraining and performance monitoring.
Each camera station captured between 4 and 8 images per component, depending on geometry, at a rate that matched the production line's cycle time. The edge computing units processed each image set in under 2 seconds, well within the available inspection window.
The defect detection model was a custom trained object detection network based on a YOLOv8 architecture, fine tuned on a dataset of over 45,000 labelled images collected from the factory's own production lines over a six week data collection period. The dataset included examples of seven defect categories: surface cracks (hairline and macro), porosity clusters, machining burrs, coating delamination, dimensional out of tolerance indicators, tool marks, and surface contamination.
KriraAI's engineering team managed the model training pipeline, using transfer learning from a base model pre trained on industrial defect datasets and then fine tuning on the factory specific data. This approach reduced the training data requirement by approximately 60% compared to training from scratch and delivered a production ready model in four weeks rather than the typical three to four months.
The AI inspection system was integrated with the factory's existing MES and ERP systems through a REST API layer. Every inspection event generated a structured data record including component ID, timestamp, station ID, defect type (if any), defect location coordinates, confidence score, and pass or fail decision. This data flowed into a centralised dashboard that gave quality managers real time visibility into defect rates, trends, and patterns across all production lines.
The system also included an automated alert mechanism. When defect rates for a specific defect type exceeded a configurable threshold within a rolling time window, the system triggered alerts to both the quality team and the production team, enabling rapid root cause investigation before large batches of defective components were produced.
The AI system went live in a phased rollout across all four inspection stations between June and September 2024. The results over the first nine months of operation were measured against the same KPIs that the factory had tracked under the manual inspection regime.
The most dramatic improvement was in defect escape rate, which is the percentage of defective components that pass through inspection undetected. Under manual inspection, the average defect escape rate was 22%. With the AI system, this dropped to 2.8%, representing an 87% reduction. The AI system achieved an overall detection accuracy of 97.2% across all seven defect categories, with particularly strong performance on surface cracks (99.1% detection rate) and porosity (98.4% detection rate). These were precisely the defect types that human inspectors found most difficult to detect consistently.
The measurable financial impact over nine months included several significant improvements:
Rework costs decreased from $380,000 annually to approximately $62,000, a reduction of 84%.
Scrap costs decreased by 71%, saving approximately $290,000 annually.
Warranty claim costs from OEM customers decreased by 79% within two quarters of deployment.
The total annual quality cost saving was calculated at $1.4 million against a total implementation cost of $410,000, delivering a payback period of just under four months, significantly faster than the originally projected 14 months.
Beyond the direct financial savings, the AI system delivered operational benefits that compounded over time. Inspection throughput increased by 35% because the AI system processed components faster than human inspectors, eliminating the bottleneck that quality checks had created on the production line. The eight quality inspectors who previously staffed the four inspection stations were reassigned to higher value roles, with four moving into process engineering and root cause analysis functions and four transitioning to the new AI system monitoring and data analysis team.
The OEM client that had issued the SCAR formally closed the corrective action within five months of AI deployment and subsequently increased order volumes by 22%, citing the measurable quality improvement as a key factor in the decision.
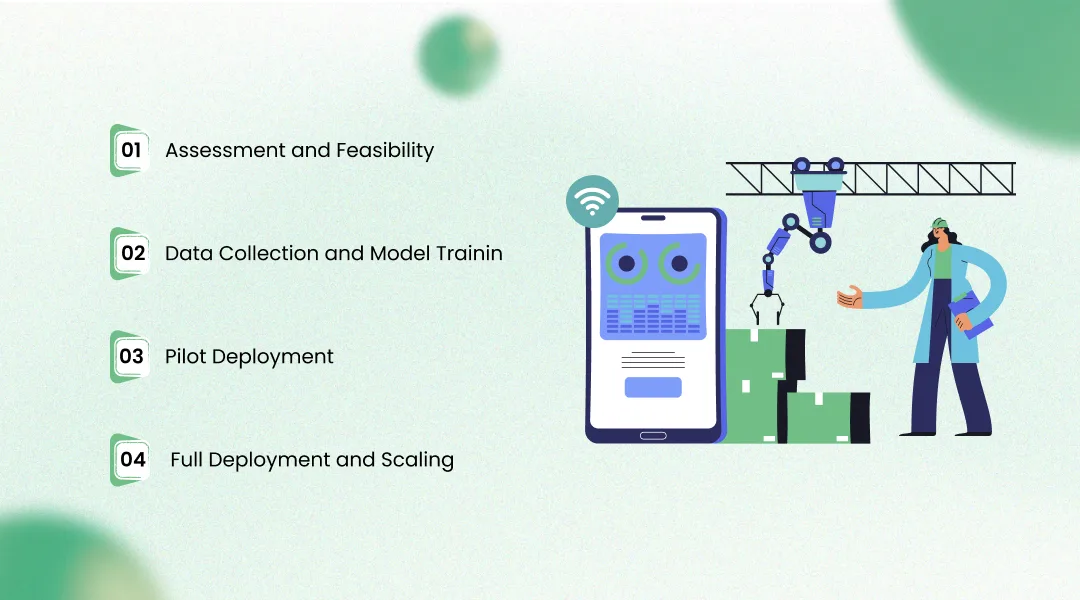
The journey from initial concept to full production deployment took approximately seven months. Understanding the specific phases of this implementation provides a replicable framework for other manufacturers considering similar deployments.
The first phase focused entirely on understanding the problem before proposing any solution. KriraAI's assessment team spent two weeks on the factory floor, observing the manual inspection process, interviewing inspectors, reviewing historical defect data from the MES, and cataloguing the types, frequencies, and locations of defects across all product families.
This phase produced three key deliverables: a defect taxonomy mapping every defect type to its detection difficulty and business impact, a data readiness assessment evaluating whether the factory had sufficient historical data and the right physical conditions (lighting, camera angles, component presentation) for computer vision, and an ROI model projecting costs, savings, and payback period under conservative, moderate, and optimistic scenarios.
With feasibility confirmed, the team moved into the most labour intensive phase: collecting and labelling the training dataset. Industrial cameras were temporarily installed alongside the existing manual inspection stations, capturing images of every component without disrupting production. Over six weeks, the system captured over 120,000 raw images. From these, the KriraAI data engineering team selected and labelled 45,000 images representing a balanced distribution of defect types and component variants.
Model training proceeded through multiple iterations, with each iteration evaluated against a held out test dataset. The team tracked precision, recall, and F1 score for each defect category, prioritising recall (minimising missed defects) over precision (minimising false alarms), since the cost of a missed defect in the auto parts industry far exceeds the cost of a false rejection.
The AI system was first deployed at a single inspection station (post machining) in shadow mode, meaning it ran in parallel with human inspectors but did not make autonomous pass or fail decisions. During this eight week pilot, the system's decisions were compared against both the human inspectors' decisions and the results of a detailed manual audit performed on a statistical sample of components.
This shadow period served two critical purposes. First, it validated the model's accuracy in real production conditions, including variations in lighting, component orientation, and production speed that laboratory testing cannot fully replicate. Second, it gave the factory's quality team and shop floor operators time to build confidence in the system before it took over decision making authority.
Following successful pilot validation, the system was rolled out to the remaining three inspection stations over a 10 week period, one station every two to three weeks. Each station deployment followed a compressed version of the pilot process: one week of shadow mode operation, performance validation, and then handover to autonomous operation.
Several pitfalls commonly derail manufacturing AI projects, and Rajesh Auto Components navigated each deliberately.
The first common mistake is underinvesting in data quality. Many factories attempt to train computer vision models on insufficient or poorly labelled data, resulting in models that perform well in testing but fail in production. Rajesh Auto Components invested six full weeks in data collection and used trained quality inspectors, not junior data labellers, to annotate the training images. This upfront investment in data quality was the single most important factor in the system's production accuracy.
The second common mistake is skipping the shadow deployment phase. Factories eager for quick ROI sometimes deploy AI systems directly into autonomous mode without a parallel validation period. This creates risk of both missed defects and excessive false rejections, either of which can undermine organisational trust in the system. The eight week shadow deployment at Rajesh Auto Components allowed the team to identify and correct 14 edge cases where the model's performance was suboptimal before granting it autonomous authority.
The third common mistake is neglecting change management. AI deployment in a factory is as much a people challenge as a technology challenge. Inspectors who have spent years developing their craft may perceive AI as a threat to their jobs and expertise. Rajesh Auto Components addressed this proactively by involving the quality inspection team in every phase of the project, from data labelling through pilot evaluation, and by creating new, higher value roles for displaced inspectors rather than reducing headcount.
Despite the strong results, the implementation was not without difficulties, and acknowledging these honestly is important for any manufacturer evaluating a similar path.
Data labelling was the most resource intensive and frustrating phase of the project. Auto parts defects are often subtle, and the boundary between an acceptable surface variation and a rejectable defect is not always clear cut. Disagreements among labellers on borderline cases required multiple review cycles and the development of a detailed labelling guide with visual reference standards. This process consumed nearly 40% of the total project timeline.
The AI system also struggles with certain defect types that remain challenging for computer vision. Internal voids and sub surface porosity, which are detectable only through X ray or ultrasonic testing, are invisible to camera based systems. The factory still relies on manual and destructive testing methods for these defect categories. Additionally, highly reflective surfaces on certain polished components create glare patterns that can mask surface defects or generate false positive detections. The team mitigated this through custom diffused lighting rigs, but the problem has not been fully eliminated.
Model drift is an ongoing operational concern. As tooling wears, raw material batches change, and new product variants are introduced, the visual characteristics of both acceptable components and defects evolve. The AI model requires periodic retraining on fresh data to maintain its accuracy. In the first nine months, the team executed three retraining cycles, each requiring approximately one week of data collection and two days of model training and validation. This is an ongoing operational cost that must be factored into the total cost of ownership.
Organisational resistance was more significant than anticipated. Despite proactive change management efforts, two senior inspectors resigned within the first three months of deployment, citing dissatisfaction with their reassigned roles. Recruitment and training of their replacements for the new AI monitoring positions took an additional two months. This underscored that even well planned technology transitions carry human costs that cannot be fully mitigated.
The deployment at Rajesh Auto Components represents the current state of the art for camera based quality inspection in auto parts manufacturing, but the technology is evolving rapidly. Several developments over the next three to five years will significantly expand what is possible.
Predictive quality, where AI models correlate real time process data (machine parameters, environmental conditions, raw material properties) with downstream defect patterns, will enable factories to predict and prevent defects before they occur rather than detecting them after the fact. Early implementations of predictive quality in automotive manufacturing have shown potential to reduce defect rates by an additional 30% to 50% beyond what inspection alone achieves.
Multi modal inspection systems that combine camera based visual inspection with thermal imaging, acoustic analysis, and inline dimensional measurement will address the current blind spots of camera only systems. These integrated sensor platforms, processed by unified AI models, will enable detection of internal defects and dimensional deviations that are currently invisible to computer vision.
Generative AI is beginning to play a role in synthetic data generation for training defect detection models. By generating realistic synthetic images of rare defect types, manufacturers can build more robust training datasets without waiting months to accumulate sufficient real examples of uncommon failure modes. KriraAI has been actively developing these synthetic data pipelines for manufacturing clients, reducing the data collection timeline from weeks to days for certain defect categories.
The competitive implications are clear. Within three to five years, AI powered quality inspection will be a baseline expectation from OEM customers, not a competitive differentiator. Tier 1 and Tier 2 suppliers who have not implemented automated inspection by 2028 will face the same existential pressure that Rajesh Auto Components faced with their SCAR notice. The cost and timeline for implementation will decrease, but so will the competitive advantage of early adoption. The window for gaining a meaningful edge through AI quality systems is open now and narrowing steadily.
Three lessons stand out from the Rajesh Auto Components deployment. First, AI powered quality inspection is not experimental technology. It is production ready, delivering measurable ROI within months, not years, when implemented with sufficient attention to data quality and change management. Second, the competitive pressure is real and accelerating. OEM customers are raising quality expectations faster than manual inspection systems can keep pace, and AI inspection is becoming the minimum standard, not a luxury. Third, the implementation path is replicable. The phased approach of assessment, data collection, shadow deployment, and gradual scaling works because it manages both technical and organisational risk simultaneously.
For manufacturers evaluating their next steps, the key is to begin with an honest assessment of current quality costs and defect patterns. KriraAI works with manufacturing enterprises to conduct these assessments and build AI quality inspection systems that are tailored to specific production environments, component types, and quality requirements. Their approach emphasises practical, measurable outcomes over technology for its own sake, ensuring that every deployment delivers a clear return on investment. If your factory is facing rising quality pressures or exploring how AI quality checks could transform your auto parts production, reaching out to KriraAI for an initial assessment is a practical first step toward building a quality system that scales with your business.
The cost of implementing AI powered quality inspection in a manufacturing facility varies significantly based on the number of inspection stations, the complexity of the components being inspected, and the existing camera and IT infrastructure. For a mid sized auto parts factory with four to six inspection stations, typical implementation costs range from $300,000 to $600,000, including hardware (industrial cameras, lighting, edge computing devices), software (model development, integration, and dashboards), and professional services (data collection, labelling, training, and deployment support). Ongoing annual costs for model maintenance, retraining, and system monitoring typically add 15% to 20% of the initial implementation cost. Most factories achieve payback within 6 to 18 months through reductions in scrap, rework, warranty claims, and inspection labour costs. The specific ROI depends heavily on current defect rates and the cost profile of quality failures in the specific product category.
AI quality inspection systems can replace human visual inspectors for surface level defect detection with significantly higher accuracy and consistency, but they cannot fully replace all quality assurance functions in auto parts manufacturing. Current computer vision systems excel at detecting surface cracks, porosity, burrs, coating defects, and certain dimensional anomalies with detection rates above 97%. However, they cannot detect internal or sub surface defects that require X ray, ultrasonic, or destructive testing methods. They also struggle with highly reflective or transparent surfaces and with defect types that require tactile assessment. The most effective approach is to redeploy human inspectors from repetitive visual tasks to higher value quality roles such as root cause analysis, process improvement, supplier quality management, and oversight of the AI system itself. This hybrid model leverages the AI's consistency and speed while preserving human judgment for complex quality decisions.
Training an AI model for manufacturing defect detection typically requires 8 to 16 weeks from the start of data collection to a production ready model, depending on the complexity of the product and the variety of defect types. The process involves three main phases. Data collection and labelling is the most time intensive phase, typically requiring 4 to 8 weeks to capture and annotate a sufficient volume of images (usually 20,000 to 50,000 labelled images for a robust model). Model training and iterative refinement typically takes 2 to 4 weeks, with multiple training cycles to optimise detection accuracy across all defect categories. Validation and shadow testing in a real production environment adds another 2 to 4 weeks. Using transfer learning from pre trained industrial defect models, as companies like KriraAI commonly do, can reduce training data requirements by 50% to 60% and shorten the overall timeline significantly. Ongoing retraining cycles after initial deployment typically require one to two weeks per cycle and should be planned for every three to four months.
AI computer vision systems in auto parts manufacturing can reliably detect a wide range of surface and near surface defects with accuracy rates typically exceeding 95%. The most common defect categories include surface cracks (both hairline and macro cracks on machined or cast surfaces), porosity (clusters of small voids visible on the surface of cast or forged components), machining burrs (excess material left on edges after CNC machining operations), coating and surface treatment defects (delamination, uneven coating thickness, and discoloration), tool marks and scoring (unintended surface damage from worn or misaligned cutting tools), dimensional anomalies visible in profile (warping, out of tolerance features detectable through silhouette analysis), and surface contamination (oil residue, metal shavings, and foreign material on finished surfaces). Detection accuracy varies by defect type, with high contrast defects like macro cracks achieving detection rates above 99% and subtle defects like hairline cracks and minor porosity achieving rates between 94% and 98%. Internal defects that do not manifest on the surface, such as internal voids and inclusions, require non visual inspection methods like X ray or ultrasonic testing.
Manufacturers implementing AI quality inspection systems can typically expect a return on investment within 6 to 18 months, depending on their current defect rates, production volumes, and the cost profile of quality failures. The primary sources of ROI include reduction in scrap costs (typically 50% to 75% reduction), reduction in rework costs (typically 70% to 85% reduction), reduction in warranty claim costs from downstream customers (typically 60% to 80% reduction within 6 to 12 months), increased inspection throughput allowing higher production volumes without additional quality headcount, and improved customer satisfaction leading to increased order volumes. In the case study documented in this article, a mid sized auto parts factory achieved total annual savings of $1.4 million against an implementation cost of $410,000, representing a payback period of under four months. This is on the faster end of typical results, partly because the factory had unusually high pre implementation defect rates. A more conservative expectation for a factory with average defect rates would be annual savings of two to four times the implementation cost, with payback in 8 to 14 months.
Founder & CEO
Divyang Mandani is the CEO of KriraAI, driving innovative AI and IT solutions with a focus on transformative technology, ethical AI, and impactful digital strategies for businesses worldwide.