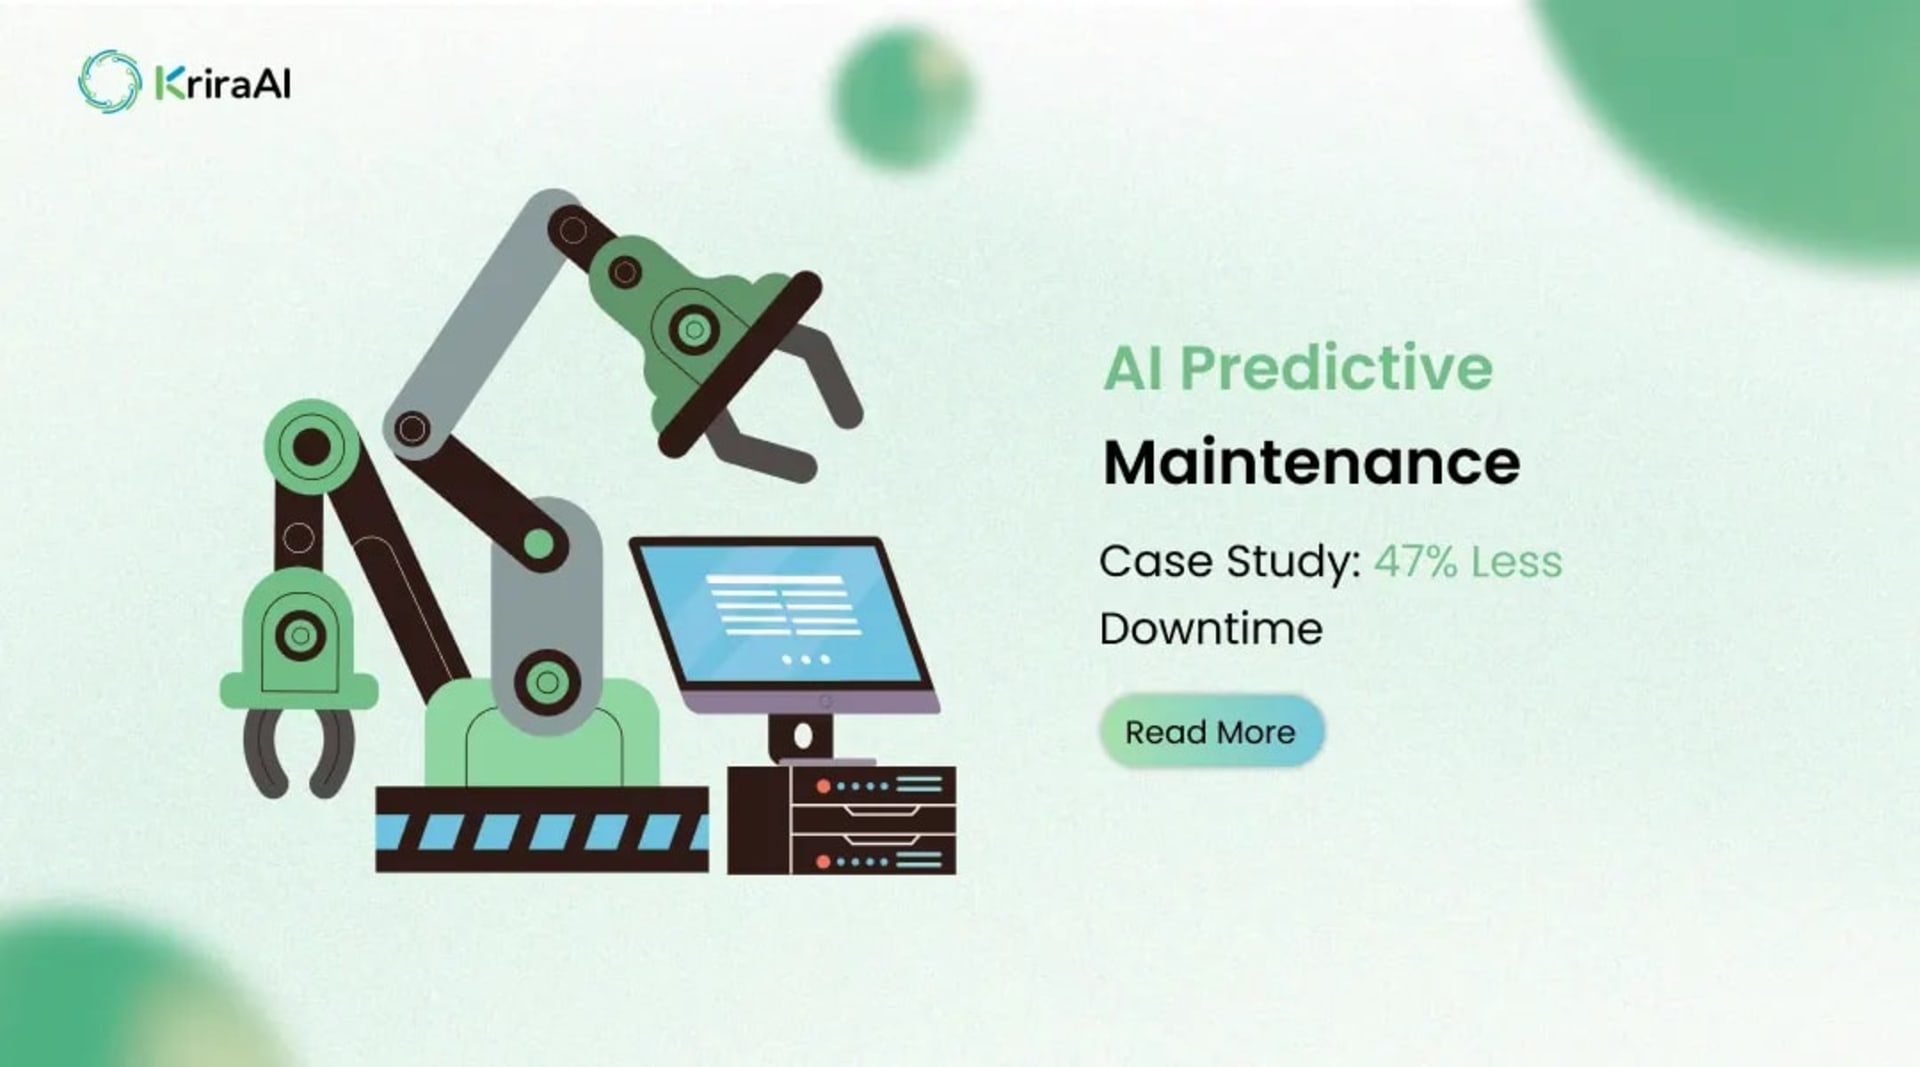
Every unplanned stoppage on a production line carries a running meter. For the manufacturer at the center of this AI predictive maintenance case study, the meter read close to 22,000 dollars per hour of stopped output. Across their plants, each critical line averaged 18 unplanned stoppages every month. Overall equipment effectiveness was stuck at 63 percent, and maintenance stayed reactive.
This is the story of the production intelligence platform that KriraAI designed, built, and deployed through its Custom AI Development Services. We are an AI solutions company that ships hardened production systems, not proofs of concept. We replaced calendar-driven maintenance with predictive maintenance machine learning that forecasts failures early. We turned dormant sensor data into an early warning system for the entire shop floor. The sections below walk through the exact problem, the full solution architecture, the technology stack, the delivery journey, and the results our client achieved.
The manufacturer ran a discrete manufacturing operation producing precision components across multiple plants. Their maintenance strategy was a mix of run-to-failure and fixed-interval preventive schedules. Machines were serviced on the calendar, not based on their actual condition. That approach wasted healthy component life and still missed the failures that mattered.
The financial bleed was concentrated in unplanned downtime. Each critical line lost roughly 4.2 hours per stoppage on average. At 18 stoppages per line each month, the plants were absorbing a high recurring cost. Emergency spare part orders, expedited freight, and idle labor compounded the direct loss of output.
The paradox was that the data already existed. Programmable logic controllers, SCADA systems, and retrofitted vibration and temperature sensors generated a constant stream of signals. That telemetry was siloed inside historian databases and rarely reviewed. No system connected sensor behavior to the failures that followed weeks later.
Maintenance knowledge lived in people, not systems. Senior technicians could often name a fault from a sound or a vibration pattern. When those technicians were unavailable, diagnosis slowed sharply. Junior staff searched paper manuals and scattered work order logs to find the right fix.
Competitive pressure made this status quo untenable. Customers demanded tighter delivery windows and higher first pass yield. Any surprise stoppage risked a missed shipment and a penalty clause. The business needed to reduce unplanned downtime in manufacturing without adding headcount.
Leadership had tried isolated dashboards and threshold alarms before. Those static rules produced constant false alarms and alert fatigue. Technicians learned to ignore them, which defeated the purpose. The organization needed condition-based intelligence that was trustworthy, explainable, and wired directly into the way they already worked. That is the environment KriraAI stepped into.
KriraAI built a production-grade predictive maintenance platform using its Enterprise AI Development Services for industrial organizations. The system continuously ingests machine telemetry, learns each asset's normal behavior, and forecasts degradation. It predicts remaining useful life for critical components and raises ranked, explainable alerts. It also gives technicians a retrieval assistant that surfaces the right repair procedure in seconds.
The platform does three jobs at once. First, it performs industrial IoT anomaly detection across multivariate sensor streams in near real time. Second, it produces multi-horizon remaining useful life forecasts for high-value assets. Third, it runs a retrieval-augmented copilot for shop-floor diagnosis. Together, these replaced guesswork with evidence.
Raw signals enter from PLCs and SCADA over OPC UA. Wireless vibration, acoustic, and temperature sensors publish over MQTT. Edge gateways buffer and forward these events into a streaming backbone. Stream processing computes engineered features such as rolling RMS, kurtosis, and spectral energy bands.
Those features feed the machine learning core. Anomaly models score each window against the asset's learned baseline. Forecasting models estimate remaining useful life with probabilistic confidence bands. When risk crosses a calibrated threshold, the platform acts automatically.
Predictions do not sit in a dashboard alone. The platform writes work orders directly into the client's maintenance management system. A planner sees the asset, the likely fault mode, and a recommended lead time. A technician opens the copilot and receives the exact procedure, torque spec, and part number.
This closed the loop that static alarms never could. Predictive maintenance machine learning generated the signal, and the integration layer turned that signal into a scheduled action. KriraAI designed the system so that every prediction had a clear owner and a clear next step. Nothing useful was left stranded in a report.
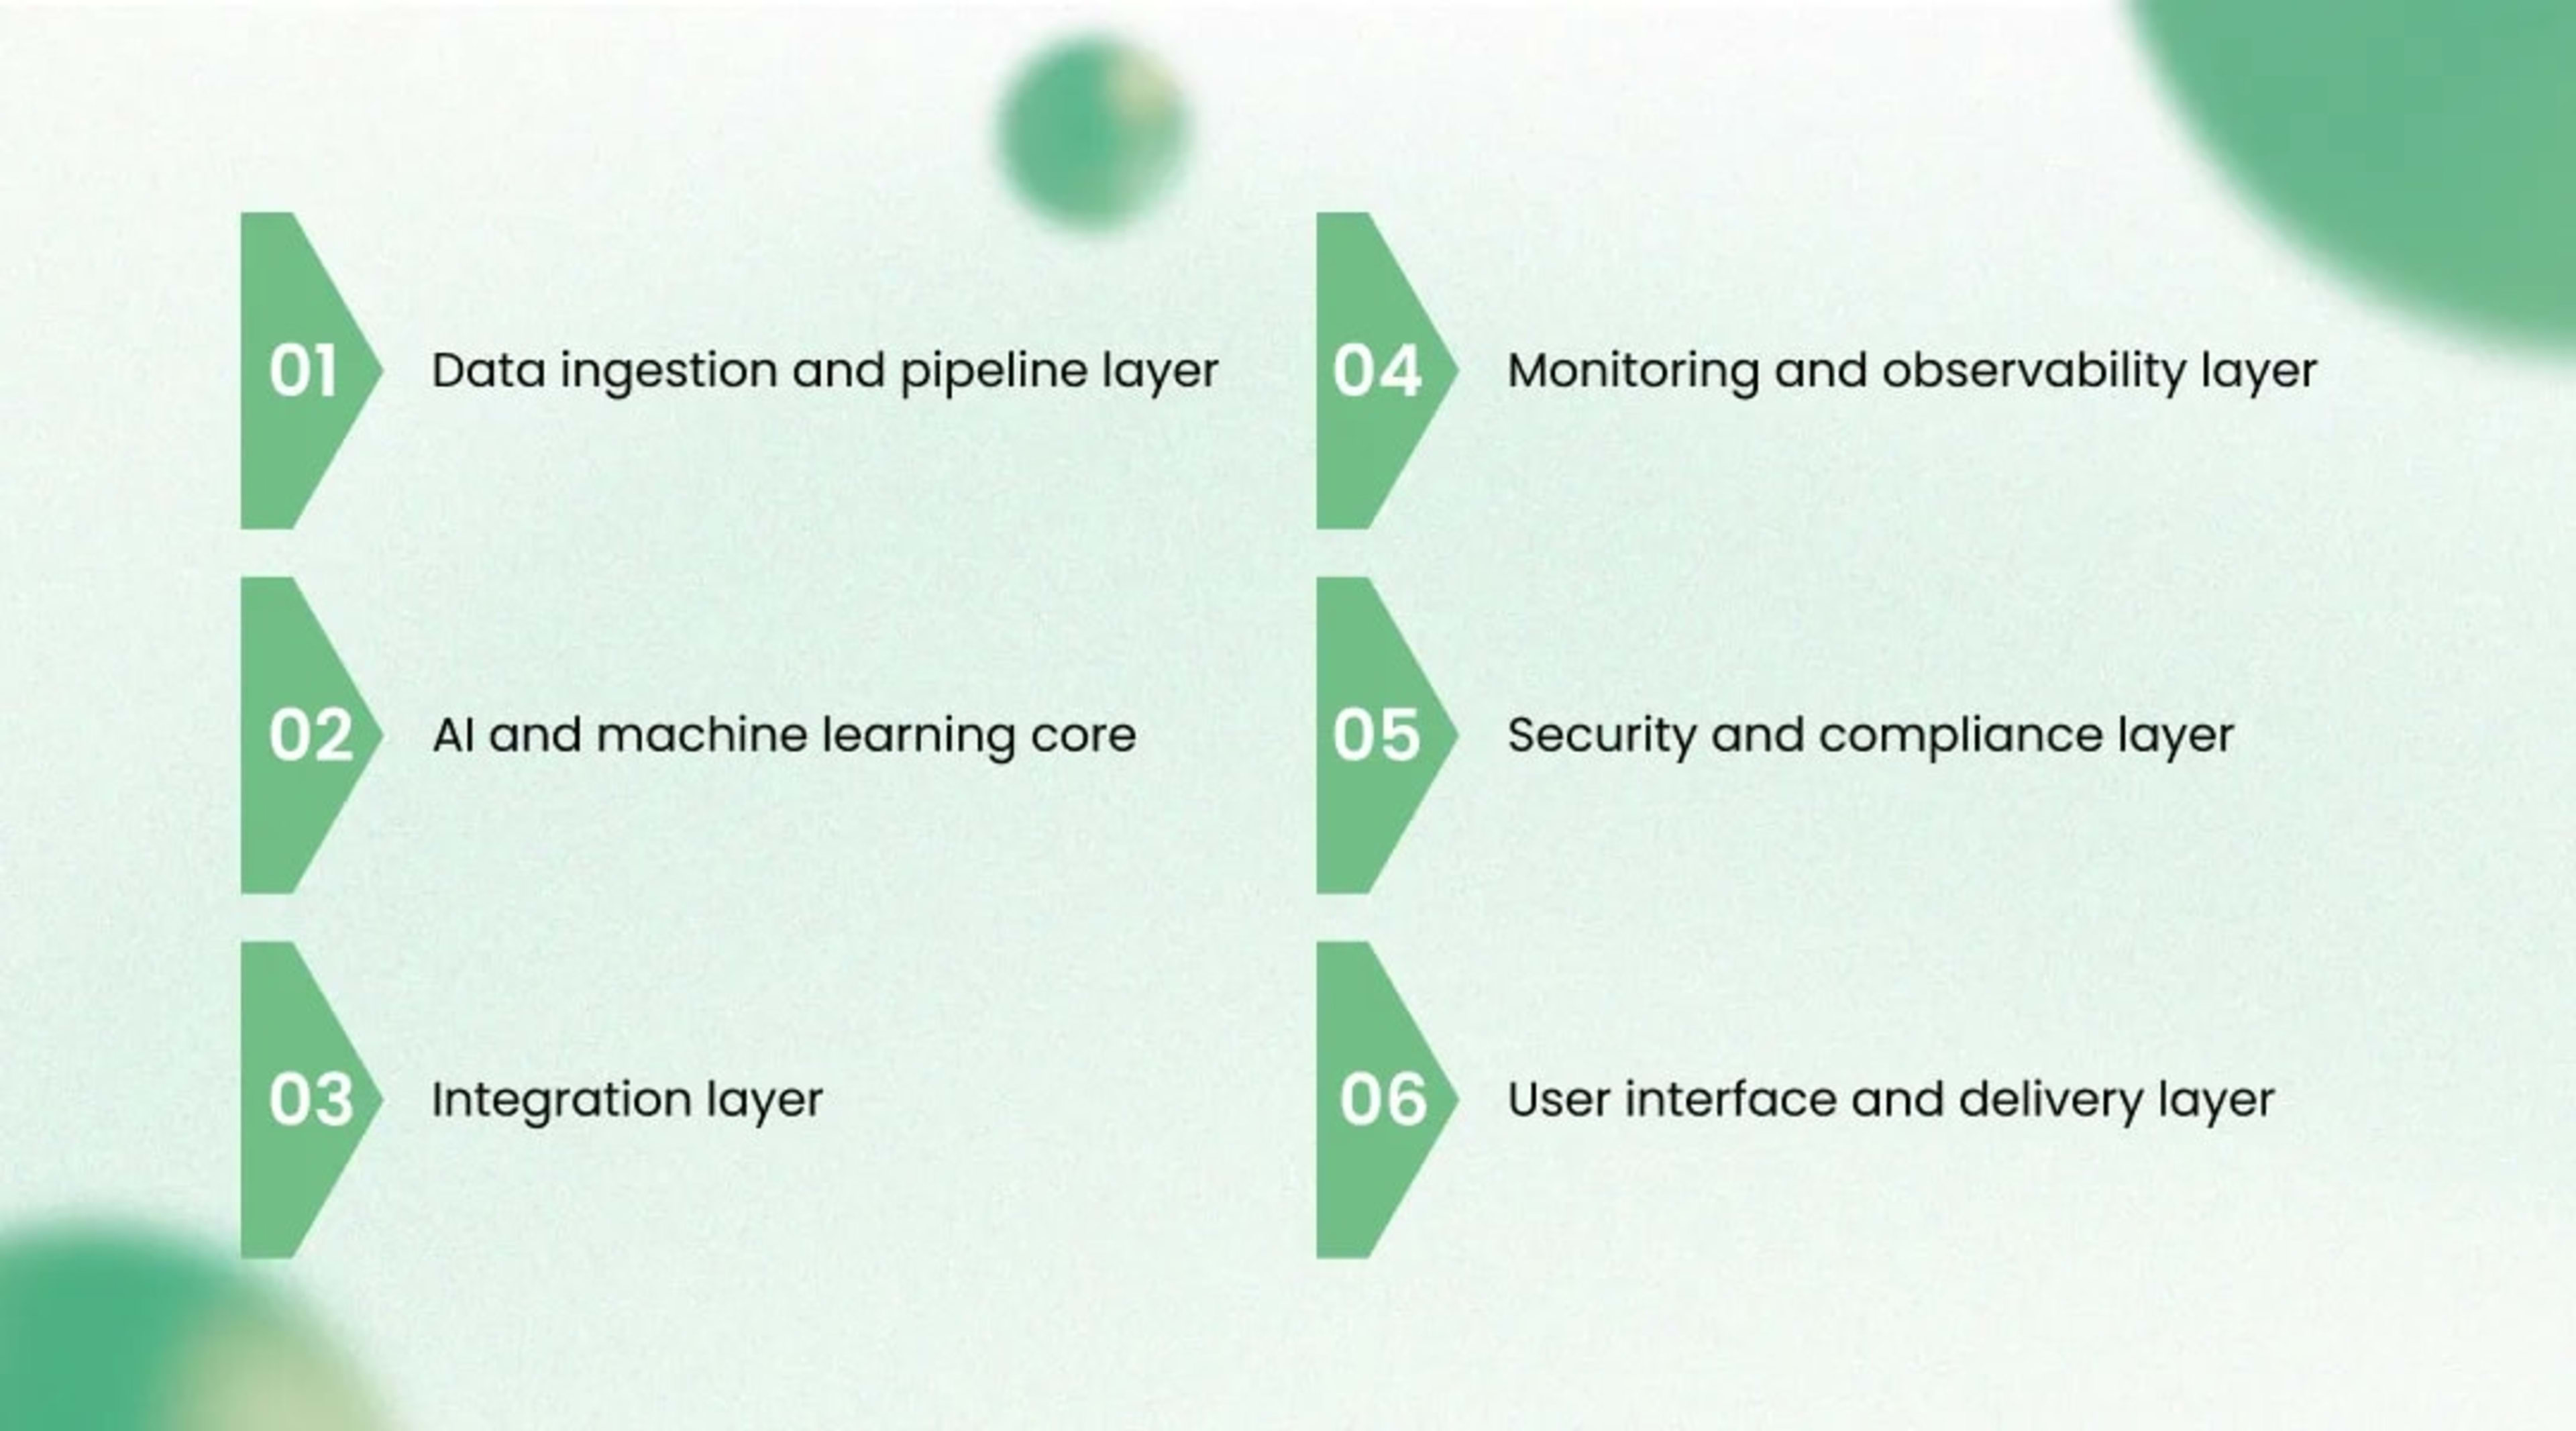
The architecture was designed as six connected layers. Each layer had a clear responsibility and a deliberate technology choice. This section walks through every layer, the design rationale, and how the layers connect. This is the engineering backbone of the AI predictive maintenance case study.
Ingestion followed two patterns. High-frequency machine telemetry arrived through event streaming, while enterprise context arrived through change data capture. Edge collectors read PLC tags over OPC UA and sensor data over MQTT. Debezium captured changes from the MES and ERP databases without loading the source systems.
All events landed on Apache Kafka with a Confluent schema registry enforcing Avro contracts. Apache Flink handled stateful stream processing and windowed feature computation. Batch orchestration ran on Apache Airflow, managing DAGs for historization and training data assembly. Time series data was stored in TimescaleDB, and raw payloads were persisted as Parquet in an Apache Iceberg lakehouse on object storage.
A Feast feature store provided consistent features for training and inference. The offline path served historical features from the lakehouse. The online path served fresh features from Redis with single-digit millisecond reads. This eliminated training and serving skew, which is a common failure mode in predictive maintenance machine learning.
The core combined several model families by design. Remaining useful life forecasting used a Temporal Fusion Transformer for probabilistic multi-horizon output. A graph neural network modeled the physical relationships between sensors on the same asset. That structure captured how a fault in one component propagates to neighboring signals.
Unsupervised anomaly detection used a variational autoencoder over sensor windows. Reconstruction error flagged deviations from learned normal behavior. A gradient boosted classifier then mapped anomalies to probable fault modes using engineered features. Contrastive learning aligns embeddings across machine families so that knowledge is transferred to assets with little failure history.
The diagnosis copilot used an open-weight large language model served with vLLM. We applied supervised fine-tuning on the client's maintenance corpus. Retrieval used a domain-tuned embedding model indexed with HNSW inside a vector database. Distributed training ran on an A100 GPU cluster, with Ray for tuning and MLflow for experiment tracking and the model registry.
The integration layer connected AI outputs to real business systems. It followed an event-driven design built on Kafka topics for predictions and alerts. Downstream services consumed those topics and triggered concrete actions. Versioned REST and GraphQL contracts served the planner dashboard.
Internal inference services communicated over gRPC for low latency. A webhook-based bridge pushed high-confidence predictions into the CMMS as draft work orders. This connected the model directly to IBM Maximo-style workflows that the client already trusted. The result was a manufacturing AI implementation that fit existing operations rather than replacing them.
Observability treated model quality as a first-class concern. Data drift was tracked with the population stability index and KL divergence on key features. Model performance was measured against held-out evaluation sets on a rolling basis. Feature distribution shift raised alerts before accuracy visibly degraded.
Infrastructure metrics flowed into Prometheus and Grafana. Latency was tracked at p50, p95, and p99 for every inference service. Distributed tracing uses OpenTelemetry to follow a prediction across services. When drift or error crossed defined thresholds, an automated retraining pipeline was triggered and gated by human review.
Security was built for an operational technology environment. The platform ran inside a private VPC with no public endpoints. Role-based access control enforces attribute-level data masking on sensitive fields. All model inputs and outputs were encrypted in transit and at rest using managed keys.
Audit events were written to an immutable append-only store. The deployment respected IEC 62443 guidance for industrial control system segmentation. IT and OT networks stayed separated following the Purdue reference model. This lets KriraAI deliver intelligence without widening the plant's attack surface.
Delivery targeted two distinct users. Maintenance planners used a React dashboard showing asset health, forecasts, and ranked alerts. Shop floor technicians used a tablet interface with the retrieval copilot. Each surface exposed only what that role needed.
The copilot answered natural language questions grounded in the client's own documents. It returned the source procedure alongside every answer for verification. This kept technicians in control while cutting search time dramatically. The interface met people where they already worked instead of forcing a new tool.
Every technology choice was made against the client's scale, environment, and constraints. We favored open standards to avoid vendor lock-in on the plant floor. We favored proven, operable tools over novelty. Below is the stack organized by layer with the rationale for each decision.
The following components formed the backbone of the platform:
Apache Kafka was chosen for the streaming backbone because it handles high-throughput sensor events with durable, replayable topics that support reprocessing.
Manufacturers implementing Industry 4.0 often combine predictive maintenance with additional AI use cases. Read our guide on Top AI Use Cases in Industry 4.0 for Indian Manufacturers to explore broader applications.
Apache Flink handled stream processing because its stateful, event-time windowing computes vibration features accurately even when sensor data arrives late.
TimescaleDB stored telemetry because it adds time series performance to PostgreSQL, which the client's team already knew how to operate.
Feast provided the feature store because it unified offline and online features and removed the training-serving skew that quietly breaks models.
The Temporal Fusion Transformer was selected for forecasting because it delivers interpretable, probabilistic, multi-horizon output rather than a single fragile point estimate.
vLLM served the language model because its paged attention delivered high-throughput inference on quantized weights within the client's GPU budget.
A dedicated vector database with HNSW indexing powered retrieval because it returned relevant procedures in milliseconds at production scale.
We deliberately ran a hybrid deployment. Latency-sensitive inference and OT connectivity stayed close to the plant, while training used elastic GPU capacity. This respected industrial IoT anomaly detection latency needs to be controlled at a cost. Every choice was made to be operable by the client's own engineers after handover.
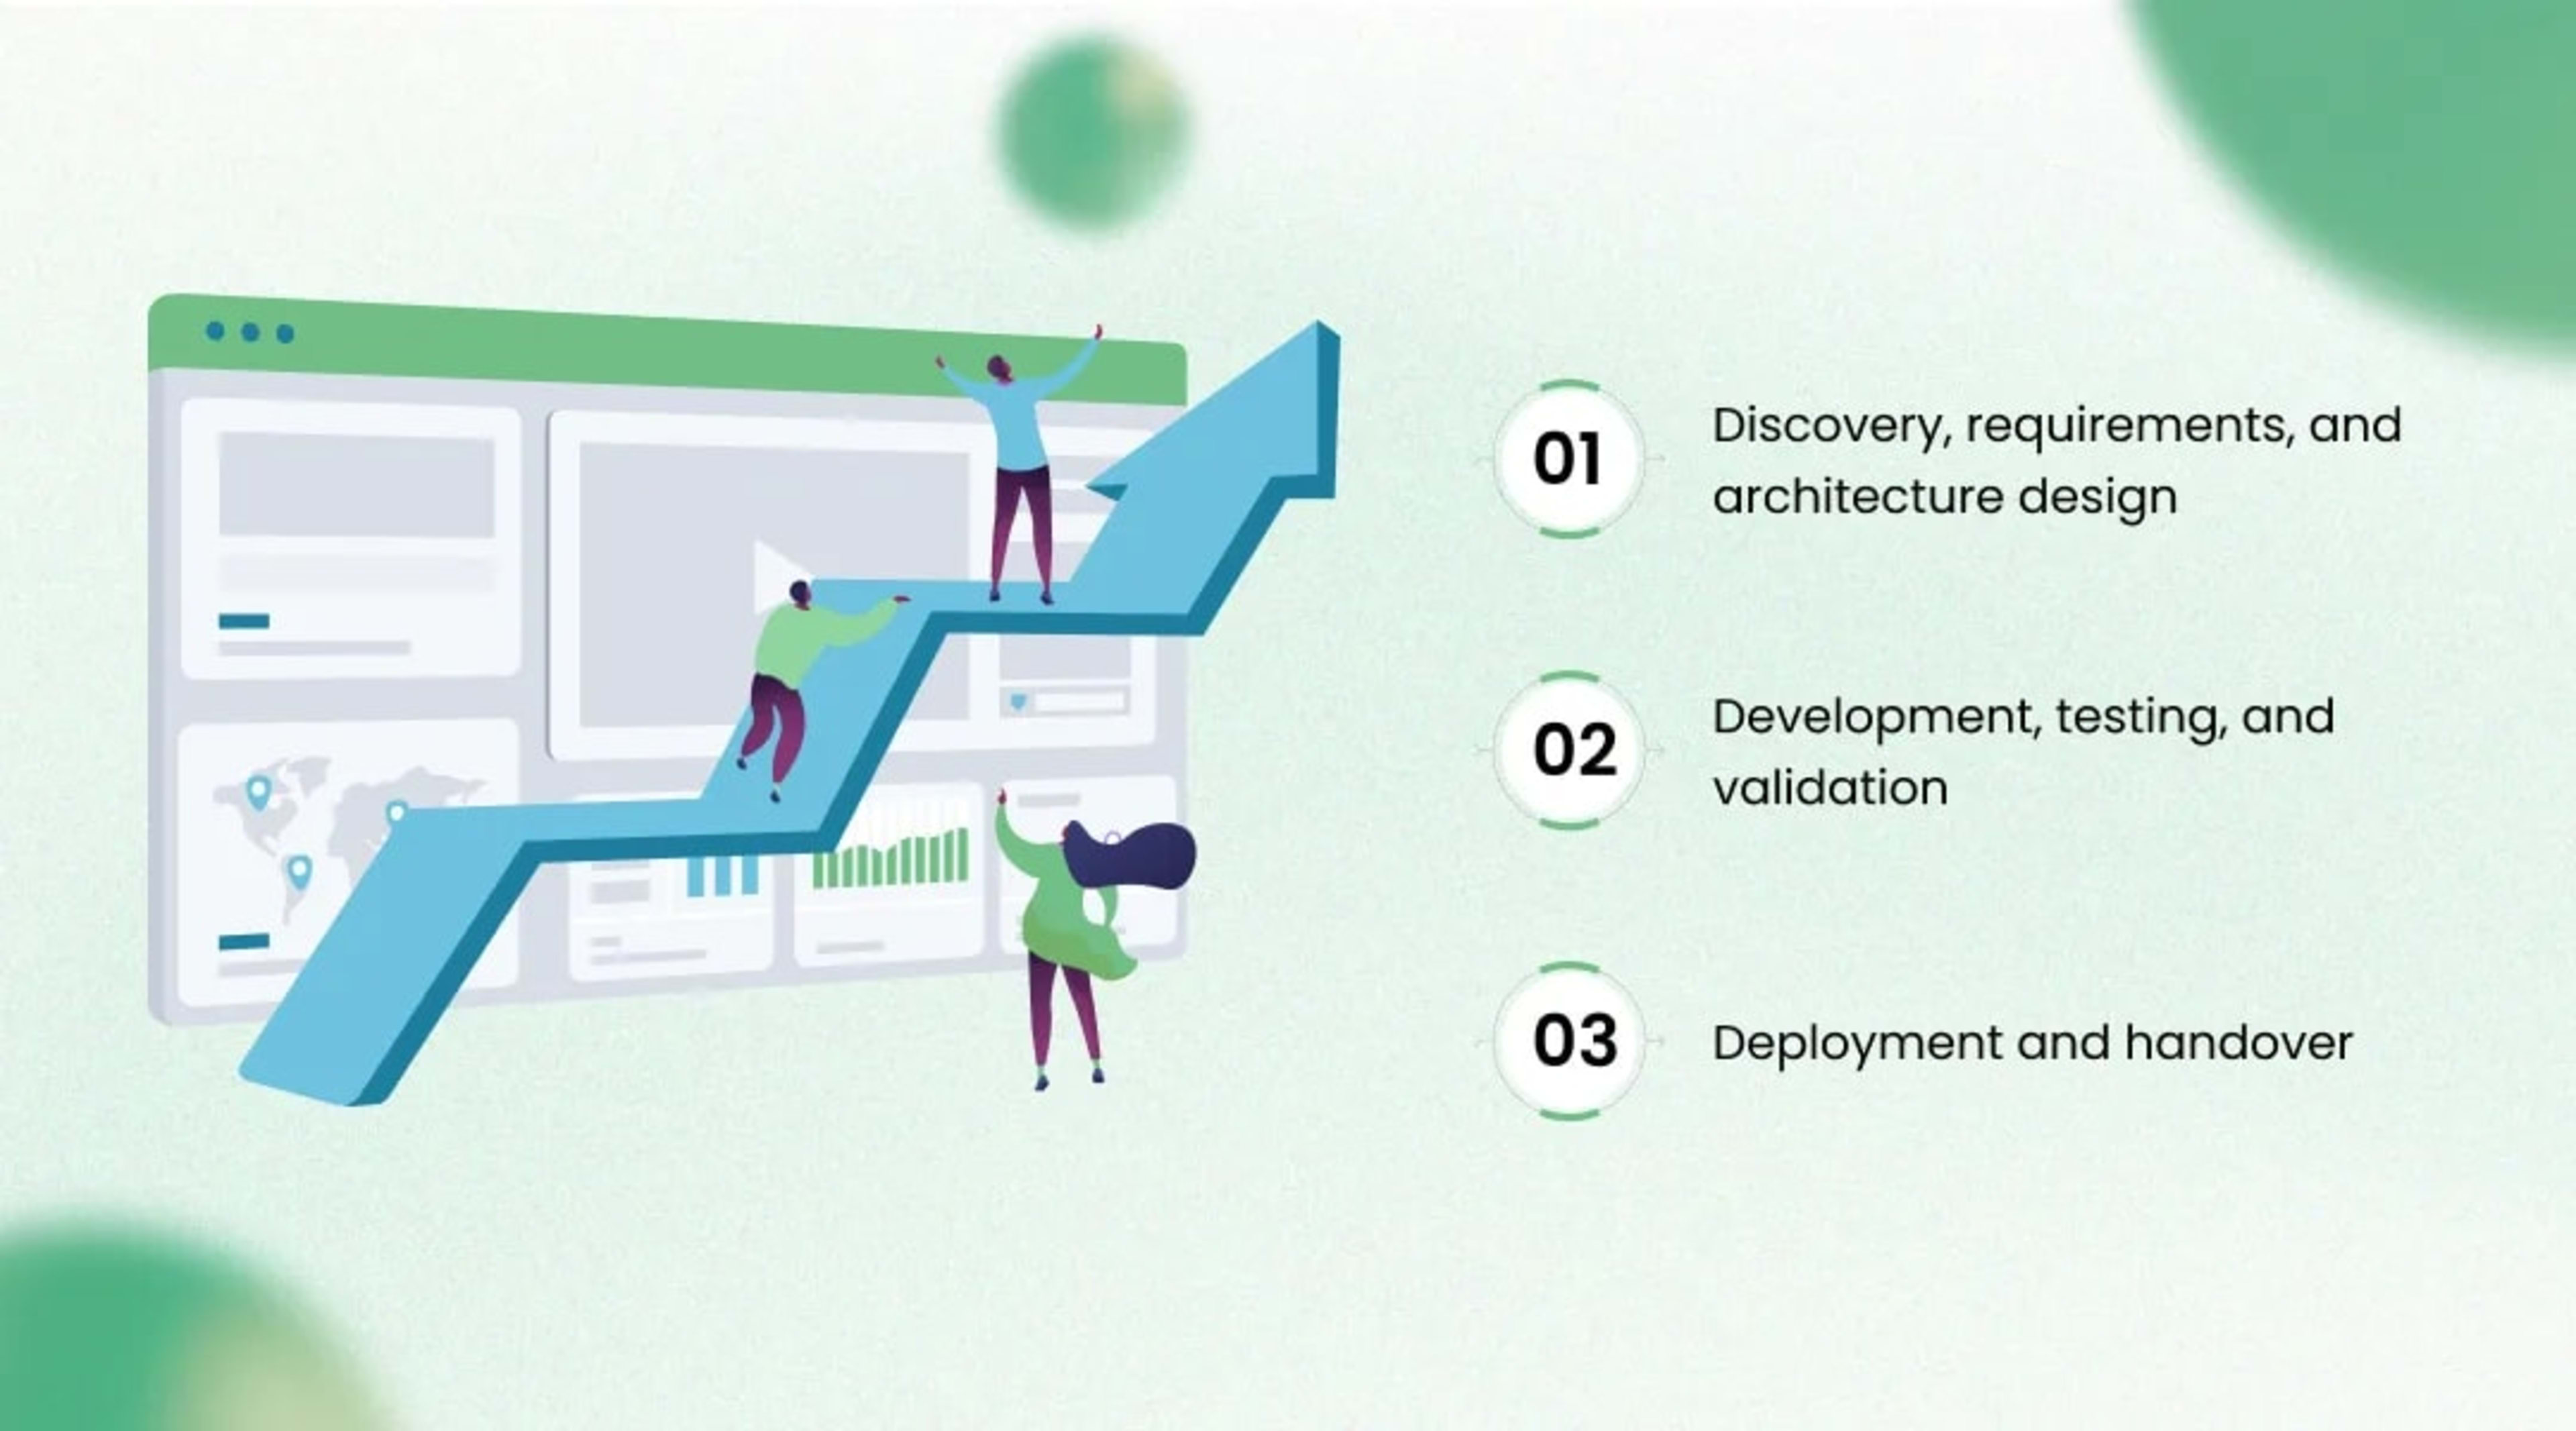
KriraAI ran the engagement across six disciplined phases. We started with discovery and finished with a supported go-live. The whole manufacturing AI implementation took the plant from baseline to production in a measured sequence. Here is how each phase went, including the problems we hit.
Discovery began with a full sensor and data audit. We mapped every asset, tag, protocol, and historian. We established the OEE baseline and quantified downtime cost per line. This gave us objective targets to design against.
Architecture design followed immediately. We chose the six-layer structure described above and validated it with the client's OT and IT teams. Every interface into their existing systems was agreed upon before a line of code shipped. That alignment prevented expensive rework later.
Development proceeded layer by layer, with the pipeline built first. We historized enough data to train credible models before touching production. Early models were validated in shadow mode against real events. The platform predicted, but humans still decided, while we measured accuracy.
Testing surfaced the honest challenges of enterprise delivery. We resolved them one at a time rather than pretending they did not exist.
The main obstacles we worked through were the following:
Some legacy machines exposed only OPC DA rather than OPC UA, so we deployed protocol translation gateways to normalize their telemetry.
Sensor clocks drifted,d and streams had gaps, so we built time alignment and principled imputation before any feature reached a model.
Failure labels were sparse and buried in free-text work orders, so we used natural language processing to extract structured failure events from history.
The first forecasting model overfit to one machine class, so we added the graph neural network and contrastive pretraining to transfer across asset families.
Early alerts were too noisy, so we introduced severity ranking andPSI-basedd suppression to defeat alert fatigue.
Deployment was phased rather than a big bang. We activated one critical line first and proved value there. We then expanded to the full plant and finally across sites. Each expansion reused the same hardened foundation.
Handover was treated as a deliverable, not an afterthought. KriraAI trained the client's engineers on operations, retraining, and monitoring. We documented every runbook and drift threshold. The team could run and extend the platform without depending on us.
The results were measured over the first 9 months after go-live. The platform moved from promising to proven within that window. Every figure below reflects confirmed outcomes from the completed engagement. This is the payoff of the AI predictive maintenance case study.
Unplanned downtime fell by 47 percent across the covered lines. Overall equipment effectiveness rose from 63 percent to 79 percent. That 16-point OEE gain flowed straight into additional sellable output. The client materially reduced unplanned downtime in manufacturing without adding staff.
Predictive maintenance is only one application of manufacturing AI. Learn how AI also transformed quality inspection in our case study How AI Replaced 200 Manual Quality Checks Daily in an Auto Parts Factory.
The before and after picture was stark on several axes:
Total maintenance cost dropped by 31 percent as reactive work gave way to planned intervention.
Mean time to diagnose fell by 58 percent once the copilot delivered procedures instantly to technicians.
Emergency spare part orders declined by 22 percent as failures were anticipated with the lead time.
Anomaly detection reached 92 percent precision after tuning, which restored trust in every alert raised.
The platform sustained inference at under 200 milliseconds at the p95 latency percentile.
The financial case closed quickly. The engagement reached payback in roughly 7 months. From that point, the platform generated net savings every month. Those numbers convinced leadership to expand the program plant by plant.
This platform was engineered to grow. The streaming backbone scales horizontally as sensor volume rises. Adding thousands more streams means adding partitions and consumers, not rebuilding. The lakehouse and feature store absorb new data without schema chaos.
New use cases sit naturally on the same foundation. Energy optimization, quality prediction from process data, and dynamic scheduling all reuse the existing pipeline. Each new model draws from the same feature store and monitoring stack. This is the compounding advantage of a real manufacturing AI implementation over aone-offf pilot.
The client's roadmap now runs two to three years ahead. Near-term work extends industrial IoT anomaly detection to auxiliary equipment and utilities. The medium term adds closed-loop process control informed by model output. The copilot will also expand into onboarding and standard operating procedure guidance.
Other manufacturers can apply the same principles directly. Start by unlocking the telemetry that already exists in your historians. Build a shared feature and monitoring foundation before chasing individual models. Wire predictions into the systems people already use so intelligence turns into action.
Three insights define this engagement. The technical insight is that combining forecasting, anomaly detection, and retrieval on a shared feature and monitoring foundation beats any single model. The operational insight is that predictions only create value when they become scheduled work orders in existing systems. The strategic insight is that a well-built platform turns one solved problem into a launch pad for many.
KriraAI brought this same rigor to every layer of the build. We are an AI solutions company that treats production reliability, security, and handover as core deliverables, not extras. We design systems your own engineers can operate and extend long after we step back. That discipline is what separates this work from a pilot who stalls.
If your plants are absorbing the cost of unplanned downtime and sitting on unused sensor data, bring that challenge to KriraAI, a nd we will architect the solution with you. The intelligence you need is likely already in your historians, waiting to be put to work.
AI predicts equipment failure by learning each machine's normal behavior from sensor telemetry, then detecting deviations that precede breakdowns. In this platform, a variational autoencoder scores multivariate sensor windows for anomalies, while a Temporal Fusion Transformer forecasts remaining useful life with confidence bands. A graph neural network captures how faults propagate between related sensors. Together, these models flag degradation early, so teams intervene before a stoppage rather than reacting after one.
The ROI of predictive maintenance AI comes from avoided downtime, lower maintenance costs, and better asset utilization. In this AI predictive maintenance case study, the manufacturer cut unplanned downtime by 47 percent, reduced maintenance cost by 31 percent, and lifted OEE from 63 to 79 percent. The engagement reached payback in roughly 7 months and produced net savings every month afterward. Returns scale further as the same platform supports additional use cases without a rebuild.
Implementation timelines depend on data readiness, asset count, and integration complexity, but a focused production rollout typically spans a few months. KriraAI delivered this platform through six phases covering discovery, architecture, development, validation in shadow mode, phased deployment, and handover. The manufacturer moved from baseline to production and measured results within the first 9 months. Starting on one critical line first, then expanding, reduces risk and proves value early before wider rollout.
Predictive maintenance machine learning needs machine telemetry plus historical maintenance context. Telemetry includes vibration, temperature, acoustic, and process signals from PLCs, SCADA, and IoT sensors. Historical context includes past failures, work orders, and asset metadata from MES and ERP systems. In this engagement, sparse failure labels were extracted from free-text work orders using natural language processing, and gaps were handled with time alignment and principled imputation before any model consumed the data.
Yes, predictive maintenance AI integrates directly with existing SCADA and CMMS systems when the architecture is designed for it. This platform ingested SCADA and PLC data over OPC UA, translating legacy OPC DA machines through gateways. Predictions were written back into the client's maintenance management system as draft work orders through a webhook bridge. Event-driven Kafka topics and versioned REST and GraphQL contracts kept everything decoupled, so intelligence reached planners and technicians inside the tools they already used.
Founder & CEO
Divyang Mandani is the CEO of KriraAI, driving innovative AI and IT solutions with a focus on transformative technology, ethical AI, and impactful digital strategies for businesses worldwide.