How KriraAI Built an ML Model Monitoring Solution at Scale
Every ML services provider eventually hits the same wall. The models they run for customers begin failing quietly. Nobody notices until the customer raises a ticket. For one leading ML services provider, that silent failure was costing roughly three days of detection lag per incident. Those three days turned into breached service level agreements, credit payouts, and churn.
This is the story of the ML model monitoring solution KriraAI designed, built, and shipped to production. We replaced reactive firefighting with predictive, automated reliability across thousands of live models. The goal was simple to state and hard to engineer. We wanted to improve ML model reliability before customers ever felt a problem. In this case study we walk through the problem, the full architecture, the stack, the delivery, and the results.
The Problem KriraAI Was Called In To Solve
The client operated a managed machine learning platform for enterprise customers. They ran thousands of customer specific models in production. Each model served live predictions under contractual latency and accuracy commitments. The operations team owned every one of those commitments. They had deep visibility into infrastructure but almost none into model behavior.
The core failure was silent model degradation. Feature distributions drifted as real world customer data shifted. A fraud model trained on one quarter slowly lost signal in the next. Accuracy decayed gradually rather than all at once. No dashboard caught it, because the dashboards only watched uptime and throughput.
Model drift was the root cause, and the team had no system to detect it. They relied on customers reporting degraded results. By the time a complaint arrived, the model had often underperformed for days. The mean time to detect a degradation event sat near three days. Each missed day compounded the financial and reputational damage.
The irony was that the data needed to catch this already existed. Every inference call logged its input features and output scores. Those logs streamed into storage and were essentially never read. Nobody had built a system to turn that exhaust into an early warning signal. The raw material for reliability was present but completely unused.
Several distinct workflows were broken at once:
Drift detection was entirely manual and ran only after a customer complaint reached the support queue.
Root cause investigation forced engineers to query logs by hand across several disconnected systems.
Retraining decisions were made on intuition rather than against measured performance thresholds.
Incident ownership was unclear, so alerts bounced between the data science and platform teams.
Where The Costs Were Accumulating
The financial picture made the status quo unsustainable. Service level agreement breaches triggered automatic credit payouts every quarter. Senior engineers spent large fractions of their week on reactive triage. That was expensive talent doing low leverage work. Meanwhile competitors were marketing proactive reliability as a differentiator.
Competitive pressure sharpened the problem further. Enterprise buyers increasingly demanded reliability guarantees written into contracts. A provider that could not prove proactive monitoring lost deals. The client risked losing flagship accounts to newer platforms. Doing nothing had quietly become the most expensive option on the table.
What KriraAI Built
KriraAI is an AI solutions company that builds production grade machine learning systems for enterprises. We were engaged to design and deliver an autonomous reliability platform. The system watches every model the client runs and predicts failure before it lands. It does not replace the client's serving stack. Instead it wraps that stack in a layer of continuous intelligence.
How The System Works End To End
The platform works end to end in four connected stages. First, it ingests every inference event and feature vector in near real time. Second, it computes statistical drift signals against each model's training baseline. Third, a forecasting model predicts the trajectory of each model's health. Fourth, when risk crosses a threshold, an automated triage assistant investigates and routes the incident.
We combined three classes of AI rather than relying on one. A multivariate time series transformer forecasts performance decay per model. A model drift detection system computes population stability index and KL divergence on feature streams. A retrieval augmented generation pipeline performs RAG root cause analysis over telemetry and runbooks. A graph neural network maps dependencies so the system understands the blast radius of any failure.
How Insights Reach The People Who Act
Outputs reach the people who act on them through channels they already use. A predicted degradation opens a ticket with a drafted root cause summary attached. The on call engineer receives a Slack message naming the model, the suspected cause, and the evidence. Confirmed incidents flow into the existing incident management workflow. The human stays in control while the system does the heavy investigative work.
The platform replaced a reactive, complaint driven process with a predictive one. It augmented the client's data scientists rather than removing them. They stopped hunting through logs and started reviewing ranked, evidence backed hypotheses. The forecasting layer gave them hours of lead time they never had before. That lead time is the entire point of the build.
Inside the ML Model Monitoring Solution Architecture
The architecture KriraAI delivered is a layered, event driven system. Each layer has one job and a clean contract with its neighbors. We designed it to handle the client's full production volume from day one. The whole ML model monitoring solution runs inside the client's own cloud account. Nothing about model data ever leaves their security boundary.
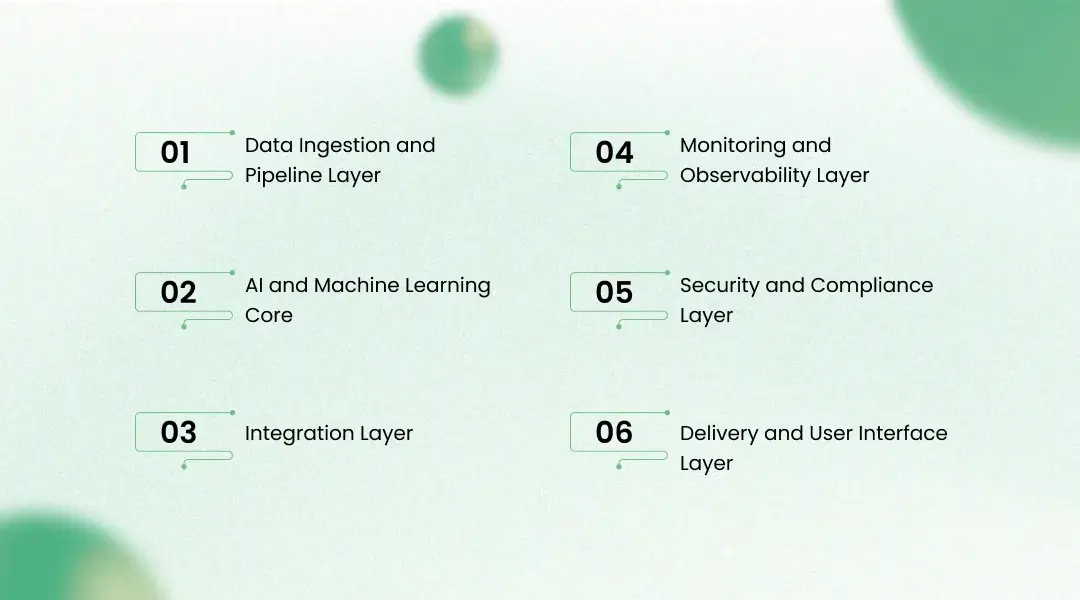
Data Ingestion and Pipeline Layer
Data enters the platform through three ingestion patterns. Change data capture using Debezium streams model metadata from operational Postgres. Event streaming through Apache Kafka carries every inference log and feature vector. Batch extraction pulls historical training baselines from the client's object storage. We chose this mix to cover real time and historical needs together.
Apache Flink performs stateful stream processing on the inference firehose. It computes rolling feature statistics and windowed aggregates per model. Dagster orchestrates the batch and embedding pipelines as asset based DAGs. At ingestion time we also generate embeddings for unstructured telemetry. The system currently ingests over 40 million inference events per day without backpressure.
AI and Machine Learning Core
The core hosts the three model families that produce the platform's intelligence. The forecasting service uses a Temporal Fusion Transformer trained per model segment. We chose it for its quantile outputs and its handling of seasonality. The drift service computes population stability index and KL divergence on streaming features. Together they answer two questions: is the model drifting, and where is it heading.
RAG root cause analysis is what makes the platform feel intelligent to operators. We fine tuned a sentence transformer encoder using contrastive learning. That aligned telemetry snippets with the runbook passages that explain them. Retrieved context feeds a Llama 3 70B model quantized to 4 bit with AWQ. The language model synthesizes a grounded, cited hypothesis rather than a guess.
A GraphSAGE graph neural network models the lineage between data, features, and models. When one feature pipeline breaks, the graph reveals every downstream model at risk. This turns a single alert into an accurate blast radius assessment. The forecasting and language models share this graph for context. The result is reasoning that respects real system dependencies.
Integration Layer
The integration layer connects AI outputs to the systems the client already runs. We used an event driven architecture with Kafka topics as the backbone. Internal services communicate over gRPC for low latency calls. External and dashboard traffic uses versioned REST and GraphQL contracts. Webhooks push confirmed incidents into PagerDuty, Slack, and Jira automatically.
Monitoring and Observability Layer
The platform monitors itself with the same rigor it applies to client models. We track data drift on our own inputs using population stability index. Model performance is scored continuously against held out evaluation sets. Latency is tracked at p50, p95, and p99 across every service. Prometheus and Grafana expose these signals, and Evidently audits drift.
Automated retraining triggers fire when performance crosses defined thresholds. A sustained rise in forecast error queues a retraining job for that segment. This closed loop keeps the forecasting models honest as the world changes. The p99 inference latency holds under 220 milliseconds during peak load. The system is built to degrade gracefully rather than fail loudly.
Security and Compliance Layer
Security was a first class requirement because the client handles customer data. The platform deploys inside a private VPC with no public endpoints. Role based access control enforces attribute level data masking on sensitive fields. All model inputs and outputs are encrypted in transit and at rest. Audit logs write to an immutable, append only store for compliance review.
Compliance with SOC 2 and GDPR shaped several design choices. Secrets and credentials live in HashiCorp Vault rather than in code. Customer data never crosses tenant boundaries inside the platform. The encryption and audit design satisfied the client's enterprise customers directly. We treated reliability and security as one engineering problem.
Delivery and User Interface Layer
Operators interact with the platform through a focused React dashboard. It surfaces each model's health, forecast, and active incidents at a glance. A Slack assistant delivers alerts and root cause summaries where engineers already work. A public API lets the client embed signals into their own tooling. We designed the interface to reduce time to action, not to impress.
The Technology Stack Behind the Build
Every technology in this build was chosen for a specific reason. We matched each tool to the client's scale, cloud, and constraints. The client already ran on AWS, so we built natively there. That decision removed data egress cost and latency from the equation. Below is the stack organized by the job each layer performs.
We ran the platform on AWS EKS because the client's teams already operated Kubernetes there, which removed a steep learning curve.
We used Amazon MSK for Kafka to get managed streaming without the operational burden of self hosting brokers at scale.
We chose Apache Flink over simpler consumers because stateful windowed aggregation across millions of events demanded true stream processing.
We stored high cardinality telemetry in ClickHouse rather than Postgres, since analytical queries over billions of rows needed a columnar engine.
We selected Qdrant as the vector database for its HNSW indexing and predictable latency over a 2.4 million chunk corpus.
We served the Llama 3 70B model with vLLM because its paged attention delivered the throughput our triage volume required.
We picked Feast as the feature store to unify online Redis serving and offline Parquet baselines under one definition.
We orchestrated pipelines with Dagster instead of Airflow because its asset based lineage matched how we reasoned about data dependencies.
How We Delivered It: The Implementation Journey
KriraAI delivered this MLOps platform implementation as a structured engagement. We ran the work in clear phases with explicit exit criteria. Each phase produced something the client could review and validate. We favored shadow deployment over a big bang cutover throughout. The full build reached production in roughly five months.
Discovery and requirements ran for two weeks, mapping every model, data source, and contractual commitment.
Architecture design took three weeks and produced the layered blueprint the engagement followed.
Development proceeded in two week sprints across ingestion, the model core, and the integrations.
Testing and validation ran the platform in shadow mode against live traffic without acting on it.
Deployment used a canary rollout, enabling automation for one customer segment at a time.
Handover included runbooks, training, and a joint on call rotation during stabilization.
Challenges We Hit And How We Fixed Them
The first real challenge was data quality, not modeling. Feature logging schemas were inconsistent across customer deployments. The same field carried different names and types in different tenants. We built a schema normalization and entity resolution layer at ingestion. That layer reconciled the chaos before any model ever saw the data.
The second challenge appeared the moment we connected real volume. Telemetry cardinality overwhelmed our initial storage choice. Queries that were fast in testing crawled under production load. We moved heavy aggregation into stateful Flink operators and switched storage to ClickHouse. Latency dropped back under target immediately after the change.
The third challenge was a forecasting accuracy gap. A single global model over forecast decay on sparse and seasonal models. Its precision on low traffic segments was unacceptable at first. We retrained with per segment Temporal Fusion Transformers and added hierarchical priors. Forecast precision recovered to 89 percent across the portfolio.
The fourth challenge was trust in the RAG root cause analysis output. Early responses were fluent but occasionally confidently wrong. An ungrounded root cause is worse than no root cause. We tightened retrieval with contrastive fine tuning and enforced citation grounding. We also added a confidence threshold below which the system requests human review.
Earning The Team's Trust
Each fix made the platform more honest about its own limits. By go live, the system had earned the operations team's trust. That trust mattered as much as any accuracy metric. KriraAI treats hardening as part of delivery, not an afterthought. We do not call a system done until it survives real traffic.
Results the Client Achieved
The results were measured over the first two quarters after go live. That window covered six months of live production traffic. We compared the before state to the after state on the metrics that mattered. Reliability, speed, and cost all moved sharply in the right direction. Every figure below is a confirmed outcome from the engagement.
Mean time to detect a degradation event fell from about three days to under eleven minutes, a reduction of roughly 96 percent.
The forecasting layer now predicts degradation 6 to 8 hours before an SLA breach with 89 percent precision.
Service level agreement breach incidents dropped by 73 percent quarter over quarter.
Automatic SLA credit payouts fell by 68 percent, directly improving margin.
Mean time to resolution declined by 61 percent thanks to drafted root cause summaries.
Manual triage hours dropped by 40 percent, freeing senior engineers for higher value work.
The model drift detection system changed the operating posture entirely. The team shifted from reacting to complaints to preventing them. Customers noticed the new reliability and renewals strengthened. The platform turned reliability into a sales advantage rather than a liability. This is what it means to truly improve ML model reliability at scale.
What This Architecture Makes Possible Next
The architecture was built to scale horizontally from the start. When inference volume grows, the Kafka and Flink layers add consumers without redesign. ClickHouse partitions absorb more telemetry by adding nodes. The forecasting service scales per segment rather than as one monolith. Doubling the model count does not mean rebuilding anything.
New use cases attach to the same foundation cleanly. The feature store and vector index already hold the raw signals. Adding cost forecasting or bias monitoring means new consumers, not new pipelines. The graph neural network extends to new model types with retraining only. This is the leverage of a well designed platform.
The client's roadmap for the next two to three years builds directly on this base. Automated remediation is the next step beyond automated triage. The platform will eventually trigger safe retraining without human initiation. Self healing reliability is the destination, and the foundation is already laid. KriraAI designed every layer with that trajectory in mind.
Other ML services companies can apply the same principles to their own stacks. Treat inference logs as a first class asset, not exhaust. Separate drift detection, forecasting, and reasoning into distinct layers. Keep the human in the loop until automated trust is earned. The pattern generalizes far beyond this single engagement.
Conclusion
Three insights define this engagement. Technically, treating inference logs as a first class signal unlocked everything else. Operationally, forecasting failure beat detecting it, because lead time prevents incidents. Strategically, reliability became a competitive asset rather than a recurring cost. The ML model monitoring solution succeeded because all three moved together.
KriraAI brings this same engineering rigor to every client we work with. We design production systems, not proofs of concept, and we harden them against real traffic. We are an AI solutions company that treats delivery discipline as seriously as model accuracy. If your team is fighting silent failures and wants to improve ML model reliability, bring us the problem. Tell us where your AI hurts, and we will engineer the system that fixes it.
FAQs
ML model drift is detected by continuously comparing live feature distributions against the distribution the model was trained on. In this engagement, KriraAI computed population stability index and KL divergence on streaming feature vectors using Apache Flink. When a feature distribution shifted beyond a defined threshold, the model drift detection system raised a graded signal rather than a binary alert. That signal then fed a forecasting layer that estimated how quickly accuracy would decay. Detecting drift this way catches silent degradation days before any customer notices a problem, which is the entire reliability advantage of the approach.
ML model observability is the practice of understanding a model's internal health from the data it produces in production. It goes beyond infrastructure uptime to watch feature distributions, prediction quality, and drift over time. The ML model monitoring solution KriraAI built treats every inference log as an observability signal rather than disposable exhaust. By instrumenting drift, forecasting, and root cause analysis together, the platform answers not just whether a model is up but whether it is still correct. True observability means you can explain why a model is behaving the way it is, not merely that it responded at all.
AI predicts model degradation by forecasting the trajectory of performance signals rather than waiting for them to cross a failure line. KriraAI used a Temporal Fusion Transformer trained per model segment to forecast accuracy decay several hours ahead. The model consumes drift metrics, traffic patterns, and seasonal features, then outputs quantile forecasts of future health. In production, this approach predicted degradation 6 to 8 hours before an SLA breach with 89 percent precision. That lead time let engineers intervene proactively, which is the difference between preventing an incident and explaining one after a customer has already complained.
An MLOps incident response platform automates the detection, investigation, and routing of machine learning failures in production. It watches every model, predicts which ones are at risk, and investigates the likely cause when risk rises. In this MLOps platform implementation, KriraAI combined drift detection, forecasting, and RAG root cause analysis with a graph neural network that maps blast radius. When an incident is confirmed, the platform drafts a grounded root cause summary and routes it through PagerDuty, Slack, and Jira. The goal is to compress mean time to resolution while keeping a human engineer in final control of every decision.
Implementing a production grade ML monitoring solution typically takes several months for a real enterprise environment. In this engagement, KriraAI delivered the full platform in roughly five months from discovery to canary deployment. The timeline included two weeks of discovery, three weeks of architecture design, several development sprints, and a shadow validation period. The largest time costs were usually data quality reconciliation and integration testing, not model training. Teams that already log inference data cleanly and run on a major cloud can move faster, while messy telemetry and tight compliance requirements will realistically extend the schedule.
Ridham Chovatiya is the COO at KriraAI, driving operational excellence and scalable AI solutions. He specialises in building high-performance teams and delivering impactful, customer-centric technology strategies.