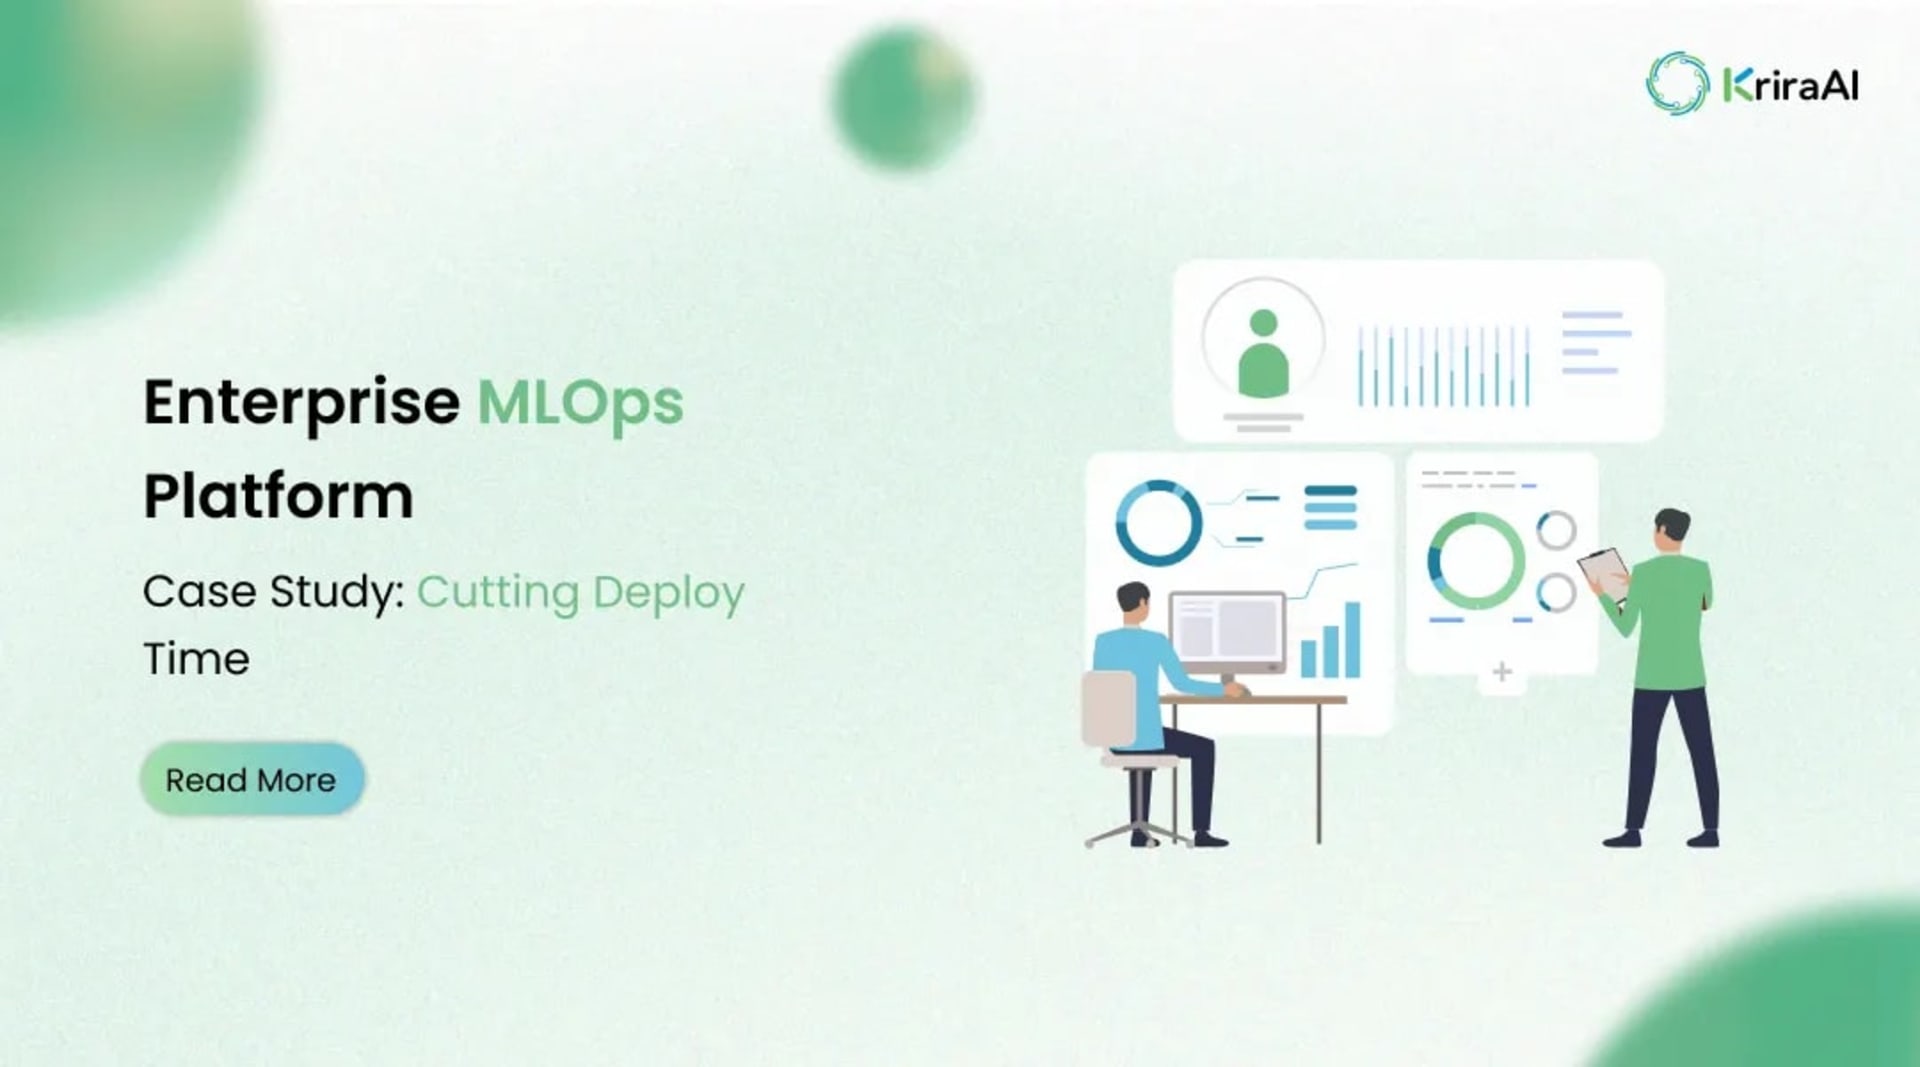
Enterprise MLOps Platform Case Study: Cutting Deploy Time
A senior data scientist at a leading enterprise data science organization once told us that the median time to move a trained model from a validated notebook into production was thirty eight weeks. That number is the quiet tragedy of modern data science, and this enterprise MLOps platform case study exists because the same number was strangling a company with more than ninety data scientists and a backlog of high value models that never shipped. Their teams were not short on talent or ideas, and their experimentation velocity was genuinely strong. The failure was entirely in the path between a working experiment and a governed production system that business units could actually trust.
We engaged with the client to design and deliver a hardened production platform that closed that gap permanently. This post walks through the operational reality they lived before the engagement, the system KriraAI built, the full solution architecture layer by layer, the technology decisions behind it, the delivery journey including the problems we hit, and the measured results after go live.
The Problem KriraAI Was Called In To Solve
The organization had grown its data science function faster than its engineering foundation could support. Roughly seventy three percent of trained models never reached production, and the ones that did arrived months after the business question that prompted them had already moved on. Their data scientists were spending close to sixty percent of their working hours on data discovery, plumbing, and one off pipeline code rather than modeling.
The workflows were broken in a very specific and recognizable way. Every team rebuilt the same features from scratch because there was no shared place to find or reuse them, which meant the same customer lifetime value logic existed in eleven slightly different and quietly contradictory implementations. Feature definitions lived in private notebooks, and the moment a notebook author changed roles, that feature became unmaintainable institutional debt.
Data existed in abundance but was almost impossible to locate. The organization ran a Snowflake warehouse with thousands of tables, dozens of streaming topics, and a sprawling object store, yet there was no semantic layer over any of it. Finding the right dataset for a new model meant pinging colleagues on Slack and hoping someone remembered where the clean version lived. This is the friction that quietly destroys data science productivity at scale.
The human decisions downstream were just as costly. Because deployed models silently decayed and nobody was systematically watching them, business teams were occasionally acting on predictions from models whose input distributions had drifted months earlier. One churn model had degraded so badly that its precision had fallen by an estimated nineteen points before anyone noticed, and the marketing spend allocated against its scores had been wasted for an entire quarter.
The competitive pressure made the status quo untenable. The client operated in a market where rivals were shipping model driven product features on a monthly cadence, while this organization measured its own shipping cadence in quarters. Leadership had concluded that the bottleneck was no longer modeling skill but the absence of an industrialized platform, and they needed a partner who could build that foundation without pausing the business. That is the point at which the engagement began, and the mandate was explicit. They wanted to reduce ML model time to production from quarters to weeks, eliminate duplicated feature work, and make model decay something the system caught automatically rather than something a human discovered too late.
What KriraAI Built
KriraAI designed and delivered an integrated enterprise machine learning platform that unified feature management, semantic data discovery, automated deployment, and continuous model observability into a single governed system. The platform did not replace the data scientists or their modeling work. It replaced the fragile, manual, undocumented connective tissue between experimentation and production with a hardened, self service foundation that the entire function shares.
At the center of the platform sits a production feature store. Our AI feature store implementation gave every team one authoritative place to define, register, discover, and serve features, with consistent definitions across both training and inference. A feature computed once is now reused everywhere, with point in time correct historical values for training and low latency values for online serving. This single decision eliminated the eleven contradictory customer lifetime value implementations and replaced them with one versioned, tested, and owned definition.
The second pillar is a retrieval augmented generation copilot for data and feature discovery. We built a semantic layer over the organization's entire data estate by generating embeddings for every table, column, feature, and dataset description, then exposing them through a natural language interface. A data scientist can now ask, in plain English, where the cleaned transaction history with refund flags lives, and the copilot returns the exact assets with lineage, ownership, and freshness, grounded in the organization's real metadata rather than a hallucinated guess.
The third pillar is an automated deployment and serving path. When a model is registered and promoted, the platform packages it, provisions a serving endpoint, wires it to the feature store for online feature retrieval, and registers it for monitoring without a human writing deployment code. This is the mechanism that collapsed the thirty eight week journey, because the entire path from a promoted model to a governed, monitored, callable production endpoint became a managed workflow rather than a bespoke engineering project each time.
The fourth pillar is continuous observability with automated remediation triggers. Every production model is watched for input drift, prediction drift, and performance degradation against held out evaluation data, and the system raises alerts and can trigger retraining workflows when defined thresholds are crossed. Outputs from the platform reach the people and systems that act on them through versioned APIs, event streams, and direct integrations into the client's existing analytics and product systems, so a prediction is never stranded inside the platform.
Inside the Enterprise MLOps Platform Case Study: Solution Architecture
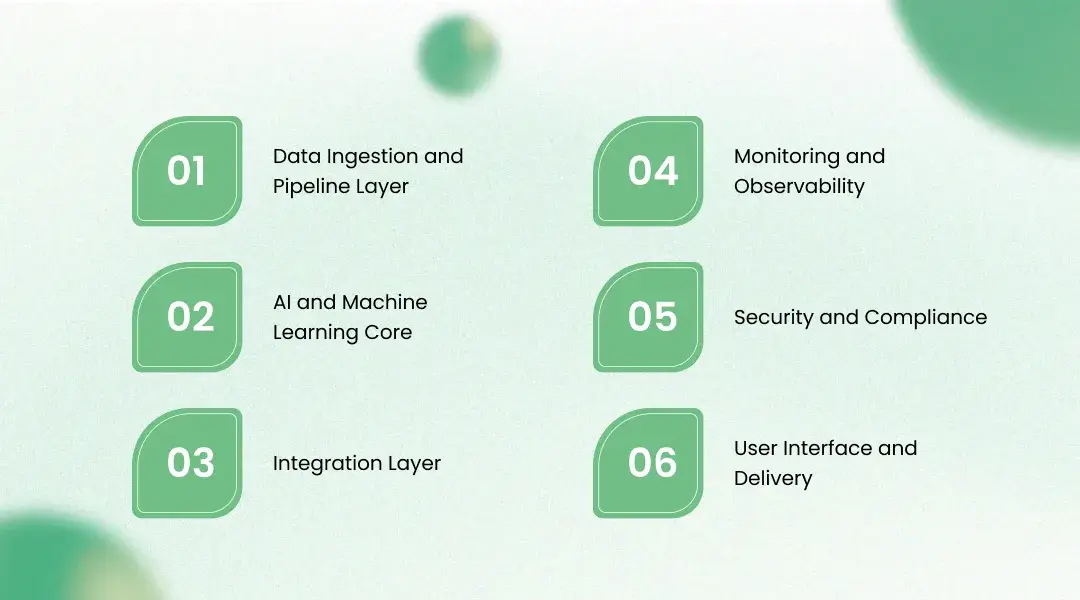
This is the technical heart of the enterprise MLOps platform case study, and we designed every layer to behave as production infrastructure under real enterprise load rather than as a demonstration. The architecture is composed of six layers that connect through clear contracts, and each layer was chosen to remove a specific failure mode the client had lived with. The guiding principle was that correctness, lineage, and reproducibility were non negotiable, while developer experience had to be good enough that adoption was voluntary.
Data Ingestion and Pipeline Layer
The ingestion layer combines change data capture, event streaming, and batch extraction so that every relevant source feeds the platform with the right latency. We deployed Debezium to capture row level changes from the operational PostgreSQL and MySQL databases, streaming those change events into Apache Kafka topics. High volume product telemetry arrived through the same Kafka backbone, while large historical loads were pulled in batch from the Snowflake warehouse.
Transformation and feature computation were split deliberately between streaming and batch paths. Apache Flink handled stateful stream processing for features that needed freshness measured in seconds, such as session level behavioral aggregates. Batch transformations, schema normalization, entity resolution across customer identifiers, and temporal feature engineering were expressed as dbt models and asset definitions, with embedding generation for the discovery layer happening at ingestion time so the catalog never lagged the data.
We chose Dagster as the orchestrator because its asset oriented model maps cleanly onto a data platform where the unit of interest is a materialized table or feature rather than an abstract task. Dagster managed the pipeline DAGs, tracked data lineage natively, and exposed sensors that the platform later used to trigger downstream work. Great Expectations ran as a data quality gate at the boundary of every critical asset, failing pipelines loudly rather than letting bad data flow silently into features.
AI and Machine Learning Core
The machine learning core is built around our Feast feature store architecture, which we selected as the open source backbone for feature management. Feast was configured with Redis as the online store for low latency serving and Snowflake plus Parquet on object storage as the offline store for point in time correct training data. This dual path design is what guarantees that the features a model sees in training are identical in definition to the features it sees in production, which is the single most common cause of silent training and serving skew.
The discovery copilot runs on a retrieval augmented generation pipeline rather than a raw language model, because grounding in real metadata was mandatory. We fine tuned an open embedding model from the BGE large family using contrastive learning on the client's own metadata and query logs, so that semantic search aligned with how their data scientists actually describe assets. Embeddings are indexed in Qdrant using HNSW graphs for fast approximate nearest neighbor retrieval, a cross encoder reranks the top candidates for precision, and a quantized Llama 3.1 70B model served through vLLM composes the grounded answer.
Model training, registration, and packaging are standardized through the core as well. Distributed training jobs run on Ray across a GPU cluster for the heavier workloads, every experiment and model version is tracked in MLflow, and predictive models are compiled and served through Triton with TensorRT optimization for the latency sensitive endpoints. The engineering rationale throughout was to give data scientists a fast path that was also a correct path, so that doing the right thing required no extra effort.
Integration Layer
The integration layer exposes the platform to the rest of the organization through stable, versioned contracts. We built the external surface as REST and GraphQL APIs using FastAPI, with explicit versioning so that consuming teams were never broken by an internal change. Internal service to service communication that needed low latency used gRPC, while asynchronous coordination between platform components flowed over the same Kafka backbone used for ingestion.
Connecting model outputs to downstream business systems was handled through an event driven pattern. When a model produced batch scores or a streaming prediction, the platform published those results to dedicated topics and fired webhooks into the client's existing product and analytics systems. This decoupling meant that a model could change or be retrained without any downstream consumer needing to know, which is exactly the resilience the previous tightly coupled scripts had lacked.
Monitoring and Observability
The monitoring layer was treated as a first class part of the system rather than an afterthought, because undetected model decay was one of the original wounds. We instrumented every production model for data drift using population stability index and KL divergence on input features, with feature distribution shift alerts raised when a feature moved beyond its calibrated band. Model performance was tracked continuously against held out evaluation sets so that quality degradation surfaced as a metric rather than a complaint.
Operational health was covered separately and just as rigorously. Latency was tracked at the p50, p95, and p99 percentiles for every endpoint, distributed traces flowed through OpenTelemetry, and Prometheus with Grafana provided the metric and dashboard layer. Evidently AI generated the statistical drift reports, and Dagster sensors consumed defined threshold breaches to trigger automated retraining workflows, closing the loop so that a decaying model could begin healing itself before a human was even paged.
Security and Compliance
Security was designed for an environment that handled sensitive customer data and was subject to external audit. We implemented role based access control with attribute level data masking, so that a data scientist could discover that a sensitive column existed without being able to read its raw values unless explicitly authorized. All model inputs and outputs were encrypted in transit and at rest, with keys managed through the cloud provider key management service.
Auditability and isolation rounded out the posture. Every access event and data movement was written to an append only, immutable audit store so that the full history could be reconstructed for compliance review. The entire platform ran inside a private virtual private cloud with no public endpoints, and the design was aligned to SOC 2 Type II controls and to the data protection regulations governing the client's jurisdictions, including strict handling of personally identifiable information.
User Interface and Delivery
Delivery met the data scientists where they already worked rather than forcing a new habit. The primary surface was a web application built in React that exposed feature discovery, model registration, deployment, and monitoring dashboards. The discovery copilot was also embedded directly into the development environment and into Slack, so that asking the platform where data lived required no context switch.
The deliberate choice to deliver through existing tools was an adoption strategy, not a convenience. KriraAI has learned across many engagements that the most elegant platform fails if it asks people to abandon their workflow, so we engineered the copilot and the registration flow to feel like a natural extension of the IDE and the chat tools the teams already trusted. That decision is a large part of why voluntary adoption climbed quickly after go live.
The Technology Stack and Why We Chose It
Every technology in the stack was selected against the client's existing environment, scale, and constraints rather than chosen for novelty. The organization was already deeply invested in Snowflake and the Python data ecosystem, so the platform was designed to extend that investment rather than fight it. The full stack, organized by layer, was as follows.
Ingestion and pipeline used Debezium and Apache Kafka for change data capture and streaming, Apache Flink for stateful stream processing, dbt for batch transformation, Dagster for orchestration, and Great Expectations for data quality enforcement.
The feature and ML core used Feast with Redis and Snowflake as its stores, Qdrant as the vector database, a fine tuned BGE large embedding model, Llama 3.1 70B served on vLLM, Ray for distributed training, MLflow for tracking, and Triton with TensorRT for predictive serving.
The integration layer used FastAPI for REST and GraphQL, gRPC for internal calls, and Kafka with webhooks for event driven delivery.
Observability used Evidently AI, Prometheus, Grafana, and OpenTelemetry, while delivery used React, an IDE extension, and a Slack integration.
Dagster was chosen over Airflow because its asset centric model and native lineage fit a data platform far better than a purely task centric scheduler. We selected Feast for the AI feature store implementation because it is the proven open source standard with a clean separation of online and offline serving, which avoided vendor lock in while still meeting the latency requirements. Qdrant won over alternatives for its strong HNSW performance and its straightforward self hosting inside the private cloud, and vLLM was non negotiable for serving the large language model efficiently because its paged attention dramatically improved throughput on the available GPUs.
How We Delivered It: The Implementation Journey
The MLOps platform implementation ran across roughly five and a half months from first session to full go live, structured into clear phases with no big bang cutover. We began with a four week discovery phase in which we mapped the data estate, interviewed data scientists about their real workflows, and instrumented the existing process to confirm the thirty eight week baseline rather than taking it on faith. This grounding mattered, because it gave us a measurable starting line against which every later result could be honestly compared.
Architecture design followed over the next three weeks, where we made the foundational decisions about the feature store, the discovery layer, and the serving path, and validated them against the client's security and compliance teams early. Development then proceeded in vertical slices rather than horizontal layers, so that within the first two months the client had a thin but complete path running end to end for a single real model. Building vertically meant the organization saw working value early and could give feedback that shaped the rest of the build.
The delivery was not without genuine challenges, and three of them are worth describing honestly. The first was data quality. Our entity resolution logic initially failed on a large fraction of records because customer identifiers were inconsistent across the operational systems, and we resolved it by building a deterministic plus probabilistic matching step into the ingestion pipeline before features were ever computed.
The second challenge was the cold start of the discovery copilot. Early retrieval quality was poor because much of the metadata was sparse or missing, so the embeddings had little signal to work with. We resolved this by running a metadata enrichment pass that used the language model to draft descriptions for undocumented assets, which subject matter experts then reviewed, and by fine tuning the embedding model on the corrected query logs so that retrieval aligned with real usage.
The third challenge was drift alert noise. The first monitoring configuration produced too many false positives because the drift thresholds were uncalibrated, which risked alert fatigue that would have killed trust in the system. We resolved it by calibrating per feature drift bands against historical variance and by requiring sustained breaches rather than single spikes before an alert fired. After testing and validation against a held out set of historical models, we ran a controlled deployment, then handed over with full documentation, runbooks, and an enablement program so the client owned the platform completely.
Results the Client Achieved
The platform produced clear, measured outcomes within six months of go live, compared against the instrumented baseline from discovery. The headline result was that median model time to production fell from thirty eight weeks to five weeks, an eighty seven percent reduction, which transformed data science from a quarterly capability into a near continuous one. This single change is what let the organization begin matching the monthly shipping cadence of its competitors.
The downstream improvements were equally concrete. The share of trained models that actually reached production rose from twenty two percent to seventy three percent, because the deployment path was no longer a bespoke engineering project. Duplicated feature engineering fell sharply once teams could discover and reuse features, and the proportion of data scientist time spent on plumbing and discovery dropped from roughly sixty percent to around twenty five percent, returning that capacity to actual modeling.
The observability layer delivered the safety the client had been missing. Automated drift detection caught more than ninety percent of meaningful model degradation events before any business impact occurred, and incidents of teams acting on silently decayed predictions fell by an estimated seventy eight percent. On the operational side, online feature serving held a p95 latency under one hundred twenty milliseconds, and the discovery copilot answered the majority of routine data location questions in seconds rather than the hours of Slack archaeology it had replaced. Taken together, these gains drove a substantial reduction in wasted compute and misallocated business spend across the first two quarters of operation.
What This Architecture Makes Possible Next
The platform was engineered to scale and extend rather than to solve a single moment, which is why its value compounds. When data volume grows, the streaming and batch paths scale horizontally because Kafka, Flink, and the Ray training cluster were all sized for elastic expansion, and the feature store's separation of online and offline stores means serving load and training load scale independently. The architecture was deliberately built so that growth is a capacity decision rather than a redesign.
Adding new use cases now happens on the existing foundation without rebuilding anything. A new model reuses the same registered features, the same automated deployment path, and the same monitoring fabric, so the marginal cost of the second hundred models is a fraction of the first. The client's two to three year roadmap builds directly on this, moving toward real time decisioning on the streaming path, an expansion of the copilot into automated feature suggestion, and a governed internal marketplace where teams publish and consume features across the organization.
Other companies in data science can apply the core lessons of this build directly to their own situation. The decisive moves were treating the feature store as the source of truth, grounding any language model capability in real metadata through retrieval rather than trusting raw generation, and making observability a first class layer so that decay is caught by the system. Any organization that adopts those three principles, even on a different stack, will reduce ML model time to production and remove the silent failures that quietly erode trust in their models.
Conclusion
Three insights from this engagement matter most. The technical insight is that a feature store treated as the single source of truth, combined with retrieval grounded language model capability and first class observability, removes the structural causes of slow and silent machine learning failure. The operational insight is that adoption is engineered, not assumed, which is why delivering the copilot inside the tools the teams already used mattered as much as the algorithms behind it. The strategic insight is that an industrialized platform converts data science from a quarterly capability into a continuous one, and that shift is what actually changes a company's competitive position.
KriraAI brought this same engineering rigor and delivery discipline to every phase of the work, from instrumenting an honest baseline before writing a line of platform code to handing over a fully owned, documented, and audited system. We build production systems that hold up under real enterprise load, not proofs of concept, and we make every technology decision deliberately against your existing environment rather than reaching for whatever is fashionable. The enterprise MLOps platform case study above is one expression of how we approach AI delivery, and the principles transfer across industries and stacks. If your data science teams are losing models in the gap between a working notebook and trusted production, bring that challenge to KriraAI and let us design the foundation that closes it.
FAQs
An enterprise MLOps platform is an integrated production system that manages the full lifecycle of machine learning models, including feature management, automated deployment, serving, and continuous monitoring, under shared governance. A data science organization needs one because modeling skill alone does not ship value, since the real bottleneck is usually the fragile manual path between a working experiment and a trusted production system. In the enterprise MLOps platform case study described here, this gap meant seventy three percent of trained models never reached production. A proper platform removes that bottleneck by standardizing the path, which is why median time to production fell from thirty eight weeks to five.
A feature store reduces ML model time to production by providing one authoritative place to define, store, discover, and serve features consistently across both training and inference. It eliminates the most common cause of delay and failure, which is each team rebuilding the same features in slightly different and contradictory ways, often producing training and serving skew that only surfaces in production. In our Feast feature store architecture, the online store served features at a p95 latency under one hundred twenty milliseconds while the offline store guaranteed point in time correct training data. By making a feature computed once reusable everywhere, the platform turned weeks of repeated plumbing into minutes of reuse.
A retrieval augmented generation copilot for data discovery is a natural language interface that lets data scientists find datasets, tables, and features by asking plain language questions, with answers grounded in the organization's real metadata rather than invented. It works by generating embeddings for every data asset, indexing those embeddings in a vector database, retrieving the most relevant assets for a query, reranking them for precision, and then having a language model compose a grounded answer with lineage and ownership. In this build we fine tuned an embedding model on the client's own query logs and used Qdrant with HNSW indexing for retrieval. This replaced hours of manual searching with answers returned in seconds.
You detect model drift by continuously comparing the statistical distribution of live data and predictions against the distribution the model was trained and validated on, then alerting when the difference crosses a calibrated threshold. The standard methods include population stability index and KL divergence for measuring input and prediction drift, alongside direct tracking of model performance metrics against held out evaluation data. In this MLOps platform implementation we used Evidently AI for the statistical reports and calibrated per feature drift bands to avoid false alarms, requiring sustained breaches rather than single spikes. The system caught more than ninety percent of meaningful degradation events before any business impact, and could trigger automated retraining when thresholds were crossed.
A full enterprise MLOps platform implementation for an organization of this size typically takes around five to six months from first discovery session to complete go live and handover, when it is delivered in vertical slices rather than as a single large cutover. In this engagement KriraAI delivered across roughly five and a half months, structured into discovery, architecture design, slice based development, testing and validation, controlled deployment, and enablement. The timeline depends heavily on the maturity of the existing data estate, the quality of metadata, and the complexity of compliance requirements. Delivering a thin end to end path within the first two months is what lets the organization see value early and adopt the platform with confidence.
Ridham Chovatiya is the COO at KriraAI, driving operational excellence and scalable AI solutions. He specialises in building high-performance teams and delivering impactful, customer-centric technology strategies.