AI-Powered Predictive Maintenance in Energy: A KriraAI Case Study

When a 180 MW gas turbine at a combined cycle power generation facility tripped offline without warning in the middle of a peak demand window, the resulting cascade was staggering. The unplanned outage lasted eleven days, cost approximately $4.2 million in lost generation revenue, triggered penalty clauses in two power purchase agreements, and forced the operator to procure replacement power on the spot market at 3.7 times the normal rate. That single event became the catalyst for a conversation with KriraAI about whether artificial intelligence could fundamentally change the way this organization managed the health of its most critical rotating and stationary assets.
This blog is the story of what happened next. It covers the operational reality we walked into, the AI predictive maintenance system KriraAI designed and deployed across 14 generation and transmission sites, the technical architecture that powers it, and the measurable results the client achieved within the first nine months of production operation. For technical leaders evaluating AI predictive maintenance in energy, this is not a theoretical framework or a vendor pitch. It is a delivery story from a completed engagement, written by the team that built it.
The Problem KriraAI Was Called In To Solve
The client operates a diversified energy portfolio spanning gas-fired combined cycle plants, onshore wind farms, a fleet of diesel backup generators at remote substations, and a high voltage transmission network covering over 2,400 kilometers of overhead and underground lines. Across this portfolio, over 6,500 individual assets require ongoing maintenance, ranging from turbines, generators, and transformers to switchgear, pumps, cooling systems, and protection relays. Before our engagement, the organization ran a maintenance program that was approximately 70% time-based preventive maintenance and 30% purely reactive, with no meaningful condition-based or predictive component in operation.
The Hidden Cost of Calendar-Based Maintenance
The time-based approach meant that assets were serviced according to manufacturer-recommended intervals or internal scheduling calendars, regardless of actual condition. This created two simultaneous and opposing problems. Assets in good condition were being pulled offline for unnecessary inspections and part replacements, consuming maintenance labor hours, spare parts inventory, and generation capacity for no operational benefit. Meanwhile, assets experiencing early-stage degradation between scheduled intervals were deteriorating undetected until a functional failure occurred. The maintenance team estimated that approximately 40% of their preventive work orders addressed equipment that was operating well within acceptable parameters, while 22% of their unplanned corrective work orders involved failures that had been developing for weeks or months before the breakdown.
The organization had invested heavily in condition monitoring infrastructure over the previous decade. Vibration sensors were installed on all major rotating equipment. Temperature, pressure, and flow sensors populated every critical process loop. Dissolved gas analysis systems monitored transformer health. Supervisory control and data acquisition systems collected operational data from every generating unit and substation. The problem was not a lack of data. The problem was that the data existed in disconnected silos, was reviewed manually by a small team of reliability engineers who could only examine a fraction of the signals in any given week, and was interpreted using static threshold alarms that generated enormous volumes of nuisance alerts while missing the subtle multivariate patterns that precede actual failures.
Alarm Fatigue and Missed Signals
The SCADA system alone generated an average of 1,100 alarms per day across the portfolio. The reliability engineering team, consisting of nine engineers covering all 14 sites, had developed an informal triage system where most alarms were acknowledged and dismissed unless they crossed critical thresholds. A post-incident analysis conducted after the turbine failure revealed that at least four distinct sensor channels had shown anomalous behavior in the 23 days before the trip, but those signals were individually below alarm thresholds and were only visible as a correlated pattern when analyzed retrospectively. The failure was predictable. The existing systems simply were not designed to detect the kind of slow, multivariate degradation signatures that characterize most catastrophic rotating equipment failures.
The financial exposure was significant. Across the portfolio, unplanned downtime was costing the organization an estimated $18 million annually in direct costs, including lost generation revenue, emergency repair expenses, spot market power purchases, and regulatory penalties. Indirect costs related to accelerated asset degradation from run-to-failure events, inventory carrying costs for emergency spare parts, and the opportunity cost of reliability engineers spending their time firefighting rather than performing proactive analysis added an estimated additional $6 million per year. The competitive landscape was intensifying as well, with newer entrants in the market operating with leaner maintenance organizations and higher asset availability, creating pressure on both margins and market share.
Solution Architecture for AI Predictive Maintenance in Energy
The architecture KriraAI designed for this engagement was built around five principles: real-time data gravity at the edge, model inference at scale without latency penalties, seamless integration with existing operational technology and IT systems, comprehensive observability across the entire ML lifecycle, and zero-trust security appropriate for critical energy infrastructure. The following subsections walk through each architectural layer in detail.
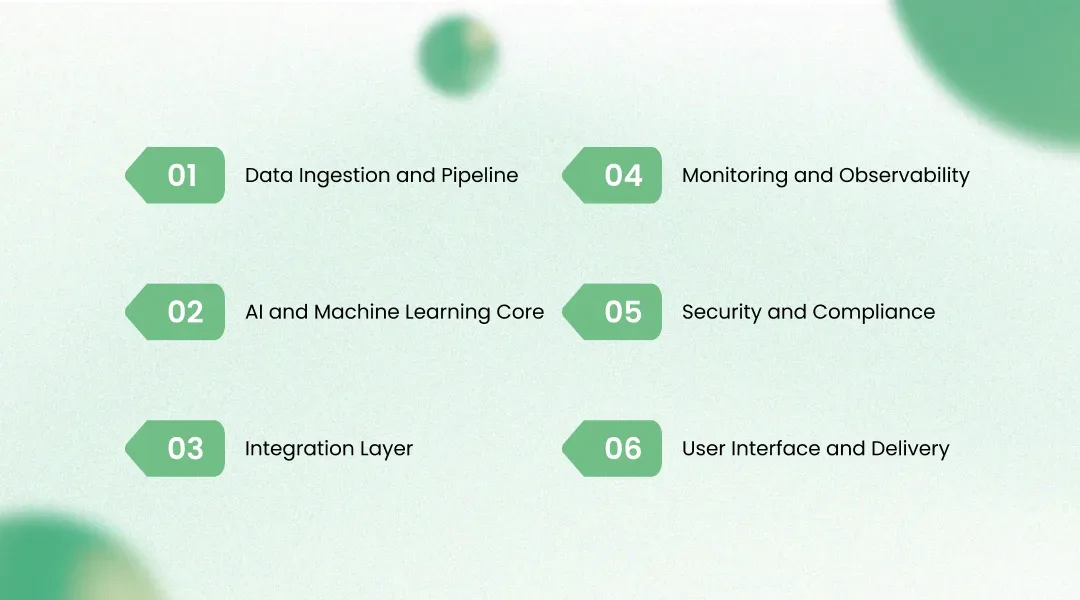
Data Ingestion and Pipeline
Data enters the platform through three primary channels. The first is a streaming ingestion path for high-frequency sensor telemetry. OPC UA servers at each site publish vibration, temperature, pressure, and electrical measurement data to a local edge gateway running a lightweight Apache Kafka producer. These edge brokers aggregate and compress sensor streams before forwarding them to the central Kafka cluster hosted on the client's private cloud infrastructure, achieving data compression ratios of approximately 8:1 through a combination of delta encoding and LZ4 compression at the producer level. The central Kafka cluster, configured with 12 brokers across three availability zones, handles a sustained throughput of approximately 2.3 million messages per second during peak operational periods.
The second ingestion path handles batch data from the enterprise asset management system, the work order management system, the laboratory information management system responsible for oil and dissolved gas analysis results, and historical maintenance records spanning seven years. KriraAI implemented change data capture using Debezium connectors against the client's Oracle and SQL Server operational databases, streaming change events into dedicated Kafka topics for near real-time synchronization without placing query load on production databases.
The third path handles unstructured data, specifically maintenance technician notes, inspection reports in PDF format, and thermal imaging files. These are ingested via a file watcher service that triggers processing pipelines in Apache Airflow, where OCR extraction, NLP-based entity recognition, and image classification models convert unstructured inputs into structured feature records.
Data transformation is handled by Apache Flink streaming jobs for real-time feature computation, including rolling statistical aggregates, rate-of-change calculations, and cross-sensor correlation features. Batch feature engineering runs on Apache Spark jobs orchestrated by Airflow, computing longer-horizon features such as degradation trend slopes, cumulative operating hour bins, and seasonal adjustment factors. All features land in a dual-serving feature store built on Feast, with an offline store backed by Apache Parquet files on S3-compatible object storage for training and an online store backed by Redis for low-latency inference serving.
AI and Machine Learning Core
The ML core of the platform is organized as a model registry serving multiple specialized model families. Each asset class has its own model ensemble, and KriraAI designed the system so that new asset classes can be onboarded by training new model instances against the shared feature store without modifying the inference infrastructure.
For rotating equipment, the primary model is a temporal convolutional network with dilated causal convolutions, trained using a self-supervised approach where the model learns to reconstruct normal operating signals and flags reconstruction errors as anomaly scores. The TCN architecture was chosen over LSTM-based alternatives after benchmarking showed 23% faster inference times and equivalent anomaly detection precision on the client's historical failure data. The variational autoencoder component operates in parallel, learning a compressed latent representation of multivariate sensor states and detecting out-of-distribution samples that may represent novel failure modes not present in the training corpus.
For static electrical assets such as transformers and switchgear, KriraAI trained XGBoost ensembles on tabular features derived from dissolved gas analysis, thermal profiles, and loading histories. These models benefit from the strong performance of gradient-boosted trees on structured, moderate-dimensionality datasets and offer interpretable feature importance rankings that the reliability engineering team uses to understand prediction rationale.
Remaining useful life estimation is handled by a separate survival analysis model using a DeepSurv neural network architecture, which outputs a time-to-failure probability distribution for each flagged asset. This model was trained on the client's seven years of historical failure and maintenance records, with careful handling of right-censored observations where assets were maintained before failure occurred.
Model training runs on a Kubernetes cluster with NVIDIA A100 GPU nodes, orchestrated by Kubeflow Pipelines. Model artifacts are versioned in MLflow and deployed to a TensorRT-optimized inference server running on Triton Inference Server, achieving p99 inference latency of 38 milliseconds per asset evaluation cycle.
Integration Layer
The integration layer connects AI outputs to the client's operational systems through three mechanisms. A REST API with OpenAPI 3.0 specification serves as the primary interface for the operational dashboard and for third-party system queries. An event-driven integration using RabbitMQ publishes maintenance recommendations directly into the client's SAP Plant Maintenance module, creating planned maintenance notifications with pre-populated fields including asset ID, recommended action, priority code, and estimated parts requirements. A webhook-based integration pushes high-severity alerts to the client's operational control room displays and triggers SMS and email escalation chains for the on-call reliability engineer.
All integration contracts are versioned independently, allowing the client's IT team to upgrade downstream systems without requiring synchronized deployments of the AI platform. gRPC is used for internal microservice communication within the platform, specifically between the feature serving layer, the inference engine, and the business impact scoring service, where sub-10ms latency is required for the real-time processing pipeline.
Monitoring and Observability
KriraAI deployed a comprehensive observability stack covering system health, data quality, and model performance. Infrastructure monitoring uses Prometheus for metrics collection and Grafana for dashboarding, tracking compute utilization, Kafka consumer lag, feature store read latency, and inference server throughput. Distributed tracing across the pipeline uses OpenTelemetry, allowing the operations team to trace a single sensor reading from edge ingestion through feature computation to anomaly score output.
Data quality monitoring runs statistical tests on incoming feature distributions, comparing each batch against a reference baseline computed from the initial training period. Population stability index and Kolmogorov-Smirnov tests flag distribution shifts that may indicate sensor calibration drift, process changes, or data pipeline errors. When data drift is detected, the affected features are logged, downstream model predictions are flagged with reduced confidence scores, and an automated alert triggers investigation by the data engineering team.
Model performance is tracked against a held-out evaluation set that is refreshed quarterly with confirmed outcomes. Precision, recall, F1 score, and mean absolute error on remaining useful life estimates are computed weekly and displayed on a model health dashboard. Automated retraining is triggered when precision drops below 0.85 or when the population stability index for any input feature exceeds 0.25 for three consecutive evaluation windows.
Security and Compliance
The platform operates within the client's private cloud environment with no public-facing endpoints. Network segmentation isolates the AI platform in a dedicated VPC with firewall rules permitting only approved traffic paths to and from OT networks, enterprise IT systems, and administrative access points. All data in transit is encrypted using TLS 1.3, and all data at rest is encrypted using AES-256 with keys managed through a hardware security module. Role-based access control is enforced through integration with the client's existing Active Directory, with attribute-level data masking ensuring that users in different roles see only the data and predictions relevant to their operational scope. All system access events and model predictions are logged to an immutable append-only audit store for regulatory compliance with the energy sector's reliability standards and cybersecurity frameworks, including NERC CIP requirements applicable to the client's bulk electric system assets.
User Interface and Delivery
The operational dashboard was built as a React-based single-page application served behind the client's existing SSO gateway. The dashboard provides a portfolio-level health overview with drill-down capability to individual asset pages showing real-time sensor feeds, anomaly score trends, active alerts, maintenance recommendations, and historical prediction accuracy for that specific asset. A maintenance planning view aggregates all active recommendations and allows planners to schedule, defer, or dismiss items, with every action recorded as a feedback signal for the model training loop. The dashboard was designed collaboratively with the reliability engineering team through three rounds of usability testing, resulting in a layout that mirrors the mental model these engineers already use when triaging asset health.
Technology Stack
The technology decisions KriraAI made for this engagement were driven by three factors: compatibility with the client's existing private cloud infrastructure running VMware-based virtualization with Kubernetes on bare metal, the need to handle sustained high-throughput streaming workloads without cloud-native managed services, and the requirement for every component to be supportable by the client's internal IT operations team after handover.
Apache Kafka was selected over alternatives such as Amazon Kinesis or Azure Event Hubs because the client's environment is on-premises and Kafka's operational maturity in self-hosted deployments is unmatched for this throughput profile. Apache Flink was chosen for stream processing over Spark Structured Streaming because Flink's true event-time processing semantics and lower latency characteristics were critical for the real-time anomaly detection pipeline. Feast was selected as the feature store because it provided the dual online-offline serving pattern required by the architecture while supporting deployment on the client's existing Redis and S3-compatible object storage infrastructure.
NVIDIA Triton Inference Server was chosen for model serving because it supports TensorRT optimization for the deep learning models and XGBoost-native serving within the same infrastructure, avoiding the need for separate serving stacks. MLflow was selected for experiment tracking and model versioning because of its broad framework compatibility and its straightforward integration with Kubeflow Pipelines for automated training workflows. The React frontend was chosen because the client's existing internal application portfolio was standardized on React, and this alignment reduced the handover and long-term maintenance burden significantly.
How We Delivered It: The Implementation Journey

The engagement spanned 32 weeks from initial discovery through production go-live, followed by an eight-week stabilization period during which KriraAI provided embedded support alongside the client's operations team.
Discovery and Requirements (Weeks 1 through 4)
KriraAI embedded a two-person team on-site for the first three weeks, conducting structured interviews with reliability engineers, maintenance planners, control room operators, and IT infrastructure leads across four representative sites. The objective was to map the complete data landscape, understand the maintenance decision workflow in detail, catalog existing system integrations, and identify the specific failure modes that caused the most operational and financial impact. This phase produced a prioritized asset class list, a data availability matrix, and a detailed integration requirements document that became the foundation for all subsequent design work.
Architecture and Development (Weeks 5 through 20)
Architecture design consumed three weeks, with two formal design review sessions with the client's enterprise architecture board. A significant challenge emerged during this phase when we discovered that sensor data from six of the 14 sites was being transmitted via legacy serial protocols through protocol converters that introduced variable latency of up to 90 seconds. KriraAI worked with the client's OT engineering team to deploy updated OPC UA gateways at these sites, bringing all data streams to a consistent latency profile.
Development proceeded in three parallel workstreams. The data engineering team built the ingestion, transformation, and feature store layers. The ML engineering team developed, trained, and validated models for the four prioritized asset classes. The application engineering team built the dashboard, the integration connectors, and the monitoring stack. Weekly integration testing across workstreams ensured that interface contracts remained synchronized.
Testing, Validation, and Deployment (Weeks 21 through 32)
Model validation was the most rigorous phase of the project. KriraAI ran each model against historical failure records to verify that the system would have detected known failures, and we conducted blind testing where the reliability engineering team evaluated anonymized model predictions against their own expert assessments. A notable challenge arose during validation of the transformer health model, where the initial model showed poor precision on transformer units that operated consistently below 60% loading. These lightly loaded transformers exhibited gas generation patterns that differed significantly from the training distribution, which was skewed toward heavily loaded units. KriraAI resolved this by stratifying the training data by loading profile and training separate model heads for each loading regime, improving precision on lightly loaded transformers from 0.54 to 0.89.
Deployment was executed as a phased rollout, starting with four pilot sites operating in shadow mode where the system generated predictions that were reviewed by engineers but not yet routed to the maintenance planning system. After four weeks of shadow operation with consistently strong prediction performance, the system was promoted to production across all 14 sites with full integration to SAP Plant Maintenance.
Results the Client Achieved
Within the first nine months of production operation, the AI predictive maintenance platform delivered measurable results across every target metric the engagement set out to achieve. These results were calculated by comparing the nine-month post-deployment period against the equivalent nine-month period from the prior year, normalized for seasonal demand variations and planned major outage schedules.
Unplanned downtime across the portfolio decreased by 73%, from an average of 847 hours per quarter to 229 hours per quarter. The system successfully predicted 34 of 37 significant degradation events during this period, with an average lead time of 18 days before the predicted failure would have occurred, giving maintenance teams sufficient time to plan and execute interventions during scheduled low-demand windows.
Maintenance labor costs decreased by 31% as unnecessary time-based preventive maintenance tasks were eliminated or rescheduled based on actual asset condition. Spare parts inventory carrying costs decreased by 22% as the system's remaining useful life predictions allowed procurement to shift from safety-stock-heavy ordering patterns to just-in-time procurement aligned with predicted maintenance needs.
The total annualized financial impact, combining avoided downtime costs, labor savings, inventory reductions, and eliminated spot market power purchases, was calculated at $14.7 million, representing a return on investment of approximately 4.8 times the total engagement cost within the first year of operation. The predictive maintenance ROI in the energy sector for this engagement exceeded the client's initial business case projection by more than 40%.
What This Architecture Makes Possible Next
The architecture KriraAI delivered was deliberately designed for extensibility across three dimensions. New asset classes can be onboarded by training additional models against the shared feature store and deploying them to the existing Triton Inference Server infrastructure without modifying any upstream or downstream components. The client has already initiated model development for two additional asset classes, cooling water pumps and gas compressors, using their own data science team working within the Kubeflow Pipelines environment KriraAI established.
Data volume growth is handled through horizontal scaling of the Kafka cluster and the Flink processing jobs, both of which were designed with partitioning strategies that allow linear throughput scaling by adding nodes. The feature store's offline path on object storage scales essentially without limit, while the online Redis store can be shared as the number of concurrently monitored assets grows.
The client's AI roadmap for the next two years includes extending the platform to support energy trading optimization by using the predicted asset availability outputs as inputs to a generation scheduling model, and deploying edge inference for the most time-critical rotating equipment where even 14-second latency is too slow for protective intervention. KriraAI designed the model serving layer with ONNX Runtime compatibility specifically to enable future edge deployment on industrial-grade inference hardware.
For other energy companies evaluating AI predictive maintenance in energy operations, the core architectural pattern of streaming ingestion, dual-serving feature store, asset-class-specific model ensembles, and tight integration with existing enterprise asset management systems is directly transferable. The key lesson from this engagement is that the AI models themselves represent perhaps 20% of the engineering effort. The remaining 80% is data engineering, integration design, and operational observability, and that is where the difference between a proof of concept and a production system is determined.
Conclusion
Three insights from this engagement stand out above the others. The technical insight is that multivariate anomaly detection using asset-class-specific model ensembles dramatically outperforms single-model approaches and static threshold alarming, but only when supported by a feature engineering layer sophisticated enough to capture the temporal and cross-sensor relationships that characterize real equipment degradation. The operational insight is that AI predictive maintenance succeeds or fails based on integration quality, meaning the most accurate model in the world delivers no value if its predictions do not reach the right person in the right system at the right time to enable action. The strategic insight is that the true value of an AI predictive maintenance platform compounds over time as the models incorporate operational feedback and as the organization builds confidence to shift from reactive to proactive maintenance culture.
KriraAI brings this same level of engineering rigour, architectural depth, and delivery discipline to every client engagement across the energy sector and beyond. Our approach is grounded in the belief that production AI systems are engineering problems first and data science problems second, and that the difference between a compelling demo and a system that transforms operations is found in the unglamorous work of data pipeline design, integration architecture, and operational observability. If your organization is dealing with the cost and risk of unplanned asset failures and is ready to explore what enterprise AI implementation in the energy industry looks like when it is done right, we would welcome the conversation.
FAQs
The timeline for implementing AI predictive maintenance in an energy environment depends significantly on the maturity of the existing sensor infrastructure, the availability and quality of historical data, and the complexity of the integration landscape with existing enterprise systems. In our engagement, the complete implementation from initial discovery through production go-live spanned 32 weeks, followed by an eight-week stabilization period. Organizations with well-instrumented assets and clean historical maintenance records can expect timelines in the range of six to nine months for a production deployment covering a portfolio of mixed asset classes. Organizations that need to upgrade sensor infrastructure or digitize paper-based maintenance records should plan for an additional three to four months of data readiness work before model development can begin.
The predictive maintenance ROI energy sector companies achieve varies based on the size of the asset portfolio, the current rate of unplanned downtime, and the cost structure of the specific energy market they operate in. In our engagement, the client achieved an annualized financial impact of $14.7 million, representing a 4.8 times return on investment within the first year of operation. The largest component of this return came from avoided unplanned downtime costs, which accounted for approximately 58% of the total savings. Maintenance labor optimization and spare parts inventory reductions contributed the remaining 42%. Energy companies operating older asset fleets with higher baseline failure rates will typically see higher absolute returns, while companies with newer assets may see proportionally greater value from the labor optimization and inventory components.
Effective AI predictive maintenance models for power generation require three categories of data. The first is high-frequency sensor telemetry from condition monitoring systems including vibration, temperature, pressure, electrical measurements, and process parameters, ideally at sampling rates appropriate to the physics of the failure modes being targeted. The second is historical maintenance and failure records, including work order descriptions, failure mode classifications, parts replaced, and timestamps, spanning at least three to five years to capture sufficient examples of degradation patterns and failure events. The third is operational context data including load profiles, ambient conditions, fuel quality parameters, and startup and shutdown event logs. The quality and completeness of historical failure records is often the most challenging data requirement, as many energy companies have inconsistent failure coding practices or have migrated between enterprise asset management systems, creating gaps in the historical record.
Integration with enterprise asset management systems is a critical design consideration that KriraAI addresses early in every engagement. In this deployment, we implemented event-driven integration using a message queue layer that publishes structured maintenance recommendations directly into SAP Plant Maintenance, creating planned maintenance notifications with pre-populated fields including asset identifier, recommended maintenance action, priority classification, and estimated parts requirements. The integration is designed to complement existing maintenance planning workflows rather than replace them, meaning the AI system creates recommendations that maintenance planners review, approve, and schedule using their existing tools and processes. This approach preserves the human decision authority that maintenance organizations require while eliminating the manual analysis burden that prevents planners from considering condition-based inputs at portfolio scale.
Managing false alarm rates is one of the most important factors in achieving adoption of AI predictive maintenance by field engineering teams. KriraAI addresses this through a multi-layered approach that begins with model architecture and extends through operational feedback loops. The models are trained using self-supervised and supervised techniques that learn asset-specific normal operating envelopes rather than relying on fixed thresholds, which dramatically reduces nuisance alerts caused by normal operational variations. A business impact scoring layer filters and ranks all anomaly detections, ensuring that only operationally significant findings reach the maintenance planning team. Most importantly, a continuous human-in-the-loop feedback mechanism allows reliability engineers to confirm or dismiss predictions, with every interaction feeding back into the training pipeline. In our engagement, this feedback loop improved the positive predictive value of high-severity alerts from 68% at initial deployment to 91% within six months of production operation, demonstrating that prediction quality improves steadily as the system accumulates site-specific operational context.
Founder & CEO
Divyang Mandani is the CEO of KriraAI, driving innovative AI and IT solutions with a focus on transformative technology, ethical AI, and impactful digital strategies for businesses worldwide.