
AI Model Monitoring and Observability: Best Practices
AI model monitoring is the practice of tracking how a deployed model behaves in production, covering output quality, data drift, cost, latency, and safety, so problems surface before users report them. For MLOps and platform engineers, the hard part is rarely collecting metrics. It is deciding which signals matter, wiring evaluations into the release path, and building alerts that people act on instead of muting.
Picture a retrieval-augmented support assistant the morning after a routine re-indexing job. Latency holds steady, error rates stay flat, and the GPU dashboard looks healthy, yet the retriever now pulls chunks from an outdated policy archive and the answers turn quietly wrong. A standard APM view is unlikely to flag it, and that gap is exactly what a deliberate monitoring and observability practice exists to close.
What Is AI Model Monitoring?
Monitoring a production AI model means continuously measuring its inputs, outputs, and operating costs against expected baselines and raising alerts when those measurements leave agreed limits. Classic model monitoring grew up around tabular classifiers, where teams compared feature distributions and eventually scored predictions against ground truth labels. Generative systems widened the scope considerably. A single request to an LLM application may touch a prompt template, a vector search, two tool calls, and a model provider, and each of those steps can fail on its own.
Monitoring vs Observability
Monitoring tells you that a known metric crossed a threshold, while observability gives you enough recorded context to explain why it happened, including failures you never anticipated. In practice, the two work as layers rather than alternatives. Dashboards and alerts sit on top, and underneath them sit traces, logs, and stored inputs and outputs that let an engineer reconstruct a bad response after the fact.
Question
Is quality dropping?
Monitoring answers with
Eval score trend against a baseline
Observability answers with
Traces of the low-scoring requests, including retrieved context
Question
Why did cost jump?
Monitoring answers with
A daily token spend alert
Observability answers with
Per-span token counts showing which agent step looped
Question
Are inputs shifting?
Monitoring answers with
A drift score per feature
Observability answers with
A sample of shifted requests linked to their upstream source
Question
Did a release cause this?
Monitoring answers with
A metric change after deploy
Observability answers with
Version tags on each trace for model, prompt, and index
Why Production AI Degrades Quietly
Production AI degrades quietly because the world that generates its inputs keeps changing after training, and most of the resulting errors return valid-looking responses rather than exceptions. A 2022 study published in Scientific Reports, "Temporal quality degradation in AI models," tested four standard model types across 32 datasets from healthcare, transportation, finance, and weather, and observed temporal degradation in 91% of the model and dataset pairs. The authors also found that degradation patterns differed between models trained on identical data, so one model's stability tells you little about the next.
Generative systems add new failure paths on top of that aging. A provider can update a hosted model behind the same endpoint name, a prompt edit can change tone across thousands of conversations, and an agent can enter a retry loop that triples token spend overnight. None of these typically trip a 5xx alert, which is why AI model monitoring has to measure behavior and not just uptime.
Industry analysts expect budgets to follow. In a March 2026 forecast, Gartner predicted that by 2028 investment in observability for large language models will reach 50% of generative AI deployments, up from 15% at the time of the forecast. The same release advised prioritizing platforms that track latency, drift, token usage and cost, error rates, and output quality, which maps closely to the signal families below.
What to Monitor: Quality, Drift, Cost, Latency, and Safety
A production AI system needs coverage across five signal families: output quality, drift, cost, latency, and safety. Infrastructure metrics such as GPU utilization still matter, but they describe the platform rather than whether the model is doing its job. The table lists a reasonable starting set, which you should trim or extend to fit your workload.
Signal family
Quality
Example metrics
Eval scores (groundedness, relevance), task success rate, user feedback rate, hallucination rate on sampled traffic
What a problem looks like
Judge scores sit below baseline for several hours
Signal family
Drift
Example metrics
Feature distribution shift, embedding drift, prediction distribution shift, topic mix of incoming prompts
What a problem looks like
A new input category appears that the model never saw in training
Signal family
Cost
Example metrics
Tokens per request, cost per successful task, cache hit rate, tool calls per session
What a problem looks like
Cost per task doubles while traffic stays flat
Signal family
Latency
Example metrics
Time to first token (TTFT), p95 end-to-end latency, per-step span duration, queue time
What a problem looks like
p95 creeps upward as a retrieval index grows
Signal family
Safety
Example metrics
Guardrail trigger rate, PII detections, prompt injection attempts, policy violation rate
What a problem looks like
Blocked outputs spike after a prompt change
Quality
Quality is the signal that matters most and the hardest to measure, because correct answers are often unavailable at request time. For classifiers and regressors, you eventually join predictions to ground truth labels and compute precision, recall, or error. For generative output, you rely on a mix of automated evaluators, user feedback such as thumbs-down or regeneration rates, and periodic human review of samples.
Track quality per segment as well as in aggregate. A support assistant can hold a steady average score while one language or one product line falls apart, and averages hide exactly that kind of regression. Slicing by customer tier, locale, and request type usually exposes the problem within a day.
Drift
Drift is any change in the statistical properties of what the model sees or produces compared with a reference period. Data drift covers shifts in inputs, prediction drift covers shifts in outputs, and concept drift means the relationship between inputs and the correct answer has changed. Concept drift tends to be the most damaging and the hardest to see without labels, which is why the drift section below focuses on proxy signals.
Cost
Cost monitoring for LLM workloads starts with token counts per request, broken down by model, prompt version, and feature. Aggregate spend alone is a lagging signal. Cost per successful task is far more useful, because it catches the agent that burns three times the tokens to reach the same outcome, or the cheaper model that fails more often and pushes users into retries.
Latency
Latency for generative systems needs at least two numbers: time to first token, which shapes perceived responsiveness in streaming interfaces, and total end-to-end time. Add per-span durations so you can tell whether a slowdown lives in retrieval, a tool call, the model provider, or your own queue. Percentiles such as p95 and p99 reveal tail problems that averages flatten out.
Safety
Safety signals track whether the system stays inside its policy boundaries. That includes personally identifiable information (PII) appearing in outputs, attempted prompt injection in inputs, toxic or off-policy responses, and for agents, actions attempted outside an allowed scope. A rising guardrail trigger rate is often the first sign that user behavior or a prompt change has shifted the risk profile.
How an AI Monitoring Pipeline Actually Works
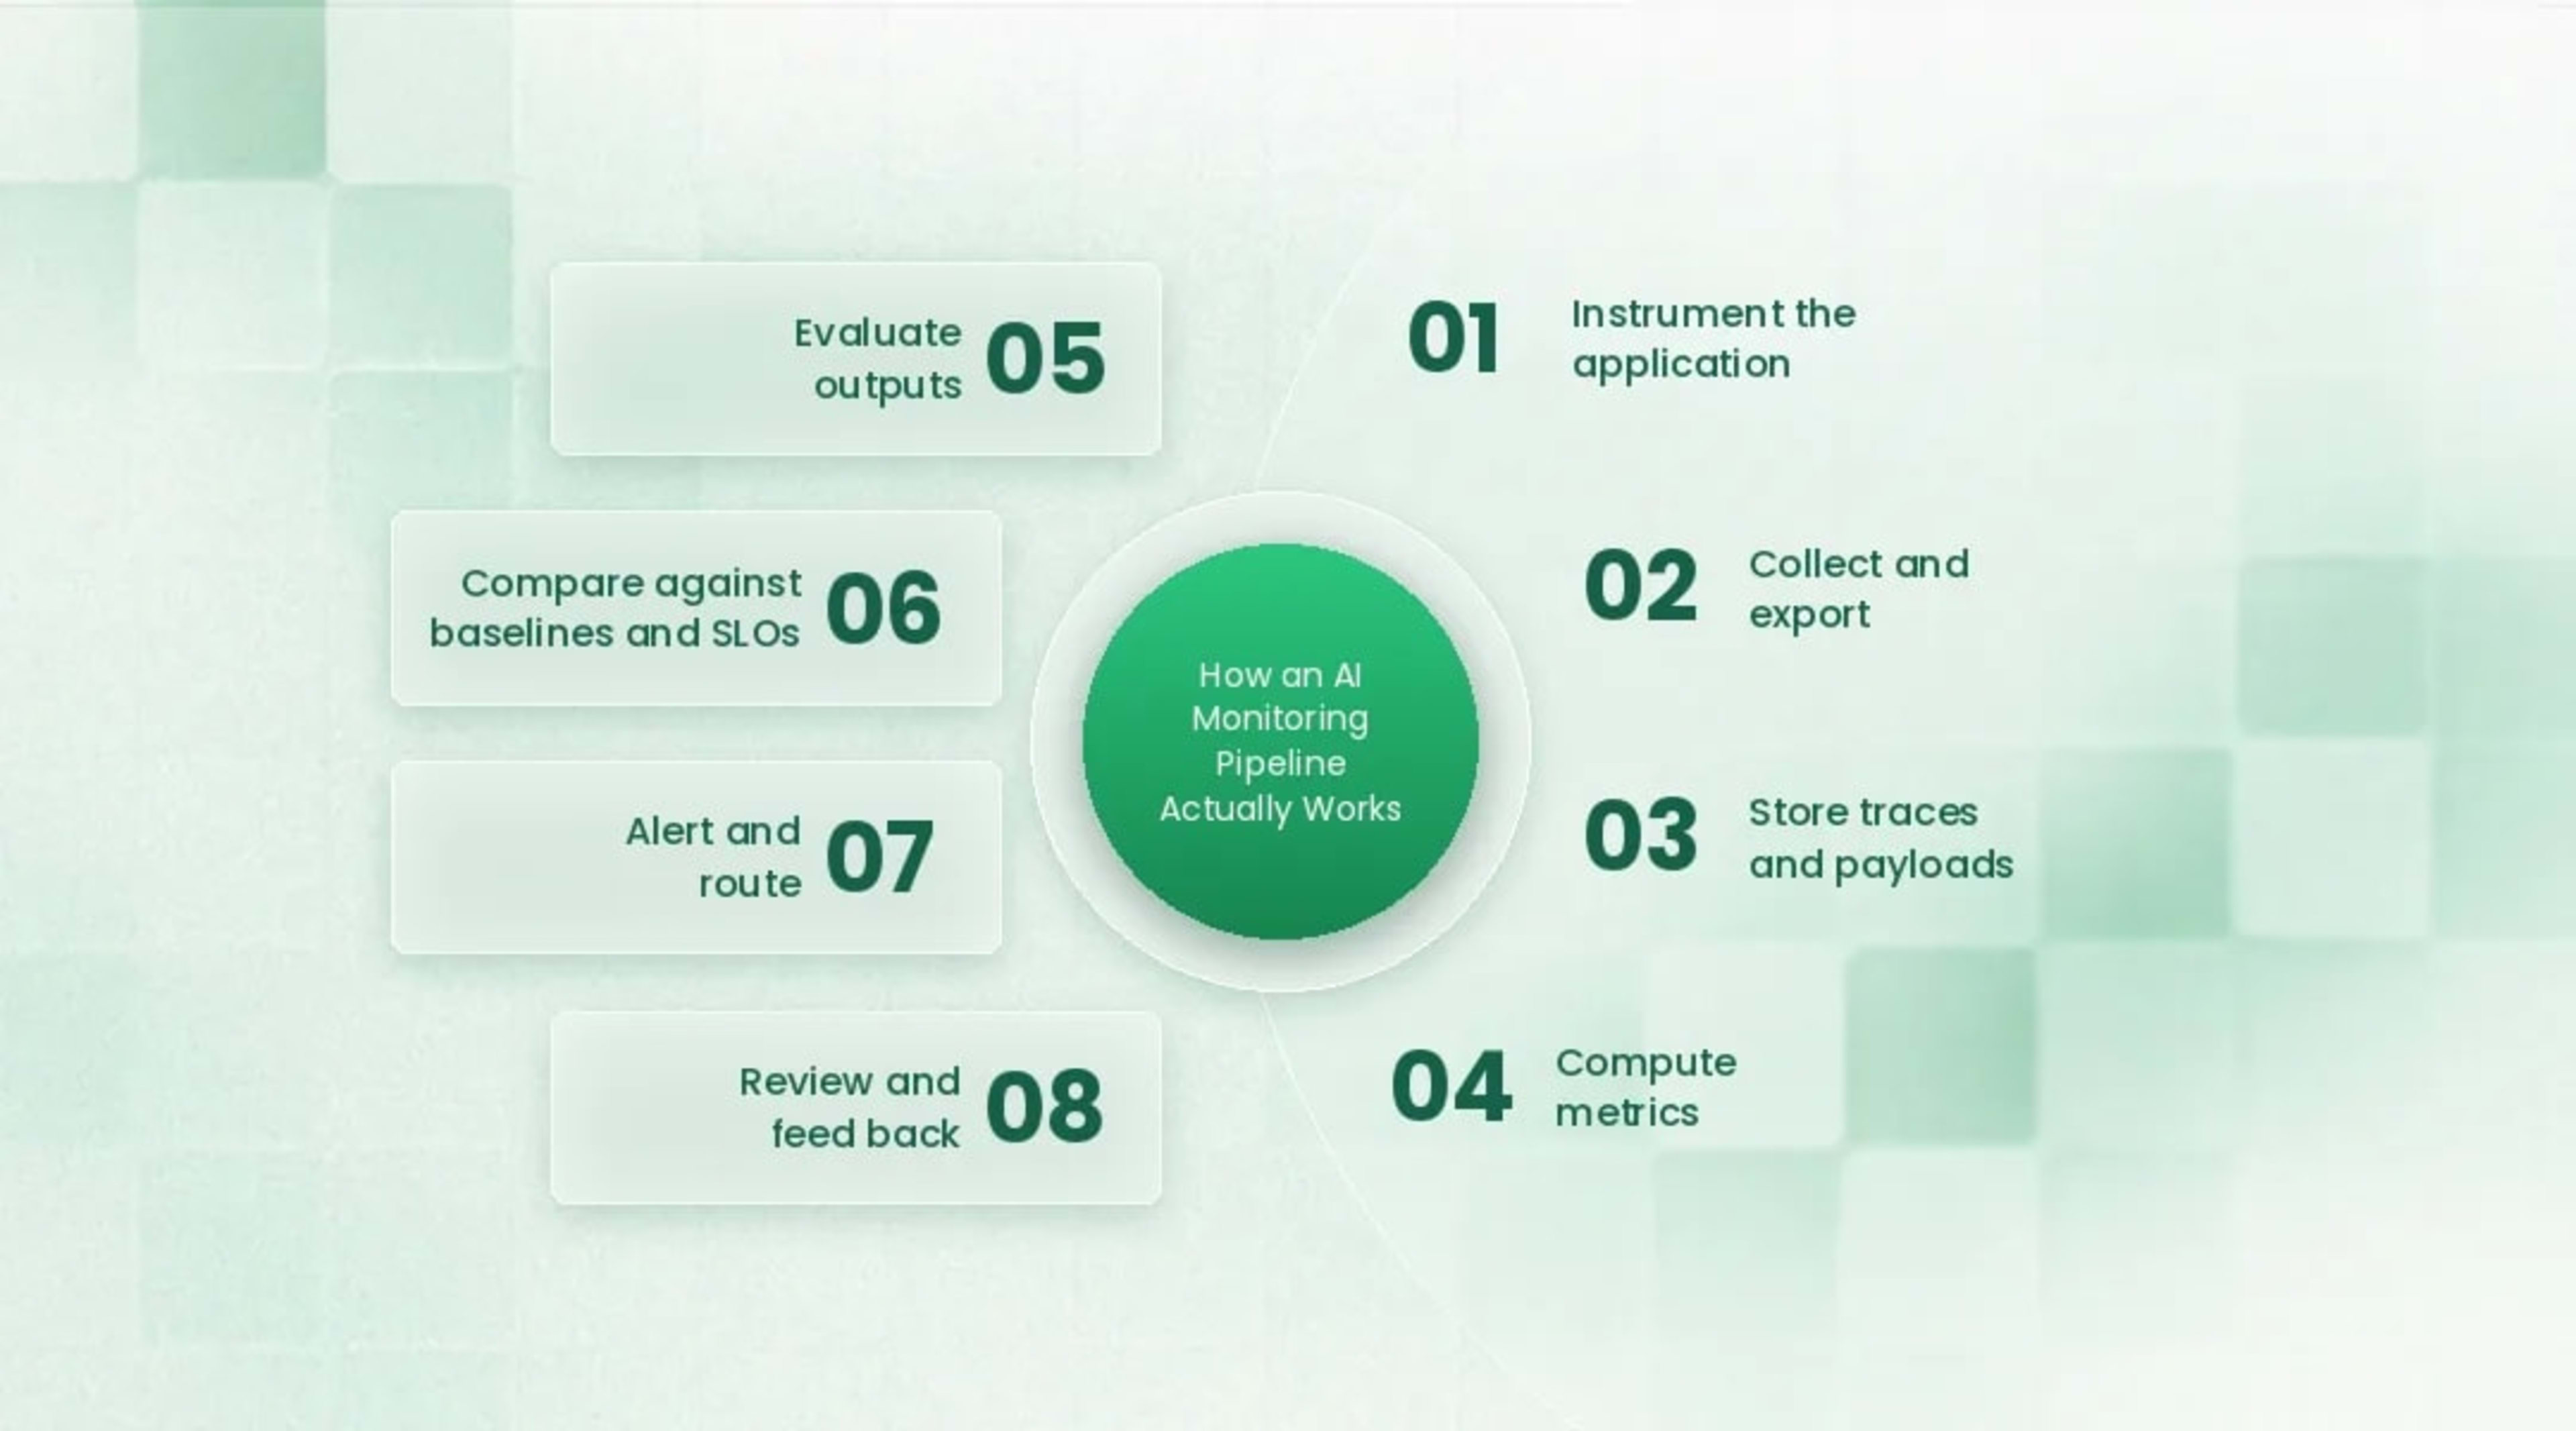
An AI monitoring pipeline captures telemetry at each step of a request, ships it to storage, scores it with metrics and evaluators, compares results against baselines, and routes deviations to people or automated responses. The numbered sequence below follows a request from instrumentation to feedback. Most production stacks implement some version of each stage, even when a single vendor hides several stages behind one dashboard.
Instrument the application. Each model call, retrieval, and tool invocation emits a span with attributes such as model name and version, prompt template version, token counts, latency, and status.
Collect and export. An OpenTelemetry SDK or vendor agent batches spans and sends them through a collector, where you can redact sensitive fields and apply sampling before data leaves your network.
Store traces and payloads. Spans land in a trace backend, while full prompts and responses go to access-controlled storage with a defined retention policy.
Compute metrics. Streaming or batch jobs aggregate latency, cost, and error rates, and run drift statistics against a reference window.
Evaluate outputs. Automated evaluators score a sample of responses for groundedness, relevance, format, and policy compliance.
Compare against baselines and SLOs. Each metric is checked against its threshold, its historical baseline, or its error budget.
Alert and route. Breaches go to the owning team through the same paging and ticketing system used for other services, with links to example traces.
Review and feed back. Humans label flagged samples, and those labels flow into evaluation datasets, prompt fixes, or retraining jobs.
On standards, the OpenTelemetry project defines semantic conventions for generative AI spans, which gives teams a shared vocabulary for attributes like model name and token usage. According to an August 2026 analysis by TrueFoundry, the project moved those conventions into a dedicated repository in June 2026 and still marks them as Development status. Adopting them is sensible, but pin versions and expect attribute names to change.
LLM Observability: Tracing Each Step of a Request
Tracing records the full path of a request as a tree of spans, so you can see which retrieval, tool call, or model invocation produced a bad result. For a retrieval-augmented generation (RAG) request, a useful trace contains a root span for the user turn, a retrieval span listing returned document IDs and similarity scores, a generation span with model, prompt version, and token counts, and tool spans with their inputs and status. For agents, the trace also needs a session identifier that ties multiple turns together.
The most common mistake is a single span covering the entire request. It tells you the request was slow or expensive, but not which step to fix. The second most common mistake is omitting version tags, which makes it impossible to connect a regression to the prompt, model, or index release that caused it.
AI Drift Detection Without Waiting for Labels
You can detect drift before ground truth arrives by monitoring input distributions, output distributions, and proxy outcome signals, then confirming suspected drift with targeted labeling. Label delay is normal for many workloads, since a fraud label may take weeks to settle and a loan default takes months. Waiting for accuracy to drop means reacting long after users felt the problem.
For tabular features, common choices are the Population Stability Index (PSI) for binned or categorical features and the Kolmogorov-Smirnov test for continuous ones. Credit-risk practice popularized a PSI rule of thumb in which values under 0.10 suggest little change, values between 0.10 and 0.25 suggest moderate change, and values above 0.25 signal a significant shift. Treat those cutoffs as a starting point only, because research in the Journal of Risk Model Validation notes they lack academic grounding and that PSI behavior depends on sample size and the number of bins.
For text and generative workloads, distribution tests on raw tokens are rarely useful. Better options include drift in embedding space between a reference set and recent prompts, shifts in the mix of detected intents or topics, changes in response length or refusal rate, and movement in evaluator score distributions. When one of these moves, pull a sample, label it quickly, and decide whether the shift actually hurts quality, because drift that leaves outcomes unchanged deserves a note rather than a page.
How to Run AI Evals in Production

Running evaluations against production traffic means scoring live or sampled outputs against defined quality criteria on an ongoing schedule, using the same metrics you trusted when you approved the release. This works best as two connected loops. One loop gates releases offline, and the other watches live traffic after deployment.
Offline Evals as a Release Gate
An offline eval runs a candidate model, prompt, or retrieval change against a fixed golden dataset before deployment. The golden dataset should contain representative requests, known hard cases, and past incidents you have turned into test cases. Wire it into CI so that a prompt edit that drops groundedness below threshold fails the build, just as a failing unit test would.
Promote releases gradually after they pass. Shadow deployment, where the new version processes copies of real traffic without serving users, and canary rollouts to a small slice of users both let online metrics confirm what offline scores predicted. If the canary disagrees with the offline result, trust the canary and investigate the gap in your golden dataset.
Online Evals on Sampled Traffic
Online evals score a sample of production traffic continuously. Running an LLM judge on all traffic is usually too expensive, so most teams sample a fixed share, oversample high-risk segments, and score all requests that a cheaper signal has already flagged. Deterministic checks such as JSON schema validation, citation presence, and regex rules are cheap enough to run on everything.
Calibrating LLM Judges
An LLM-as-a-judge evaluator uses one model to grade another model's output against a rubric, and it becomes useful only after you check its agreement with human reviewers. In the 2023 NeurIPS paper "Judging LLM-as-a-Judge with MT-Bench and Chatbot Arena," Zheng and colleagues found that strong judges such as GPT-4 agreed with human preferences more than 80% of the time, roughly matching agreement between humans. The same paper documented position bias, verbosity bias, and self-enhancement bias, meaning a judge can systematically favor longer answers or outputs from its own model family.
Calibrate before trusting the scores. Have humans label a few hundred examples, measure judge agreement on your own domain, and re-check whenever you change the judge model or rubric. Keep rubrics narrow with one criterion per prompt, because a judge asked to rate "overall quality" produces scores that are hard to act on.
Guardrails: Monitoring That Acts in Real Time
Guardrails are runtime checks that inspect inputs and outputs inline and then block, rewrite, or escalate a request before harm reaches the user. Monitoring observes after the fact, while guardrails intervene during the request, and the two feed each other. Each guardrail decision should emit telemetry so you can watch trigger rates the same way you watch latency.
Input guardrails typically screen for prompt injection patterns, PII the user should not be sending, and requests outside the product's scope. Output guardrails check schema validity, PII leakage, toxicity, and in RAG systems, whether claims are supported by the retrieved context. For agents, add action guardrails that confirm a tool call falls within allowed parameters before it executes.
Track false positives as carefully as true ones. A guardrail that blocks even a small share of legitimate requests creates a quiet product failure of its own. Sample blocked requests for human review and tune thresholds with real data instead of vendor defaults.
Alerting and Escalation That Engineers Trust
Good AI alerting ties each alert to user impact, sends it to a clear owner, and includes enough context to start diagnosis without opening five tools. Alert fatigue is the likely outcome when each drift score gets its own page. The remedy is a severity model that separates what needs a human now from what needs a ticket this week.
Severity
Page now
Example trigger
Guardrail bypass detected, PII in outputs, error rate breaching SLO, runaway cost burn
Response
Mitigate within minutes through rollback, kill switch, or fallback model
Channel
On-call pager
Severity
Same day
Example trigger
Online eval scores below baseline for a sustained window, p95 latency SLO at risk
Response
Investigate traces and decide on rollback
Channel
Team channel plus ticket
Severity
This week
Example trigger
Moderate drift with no quality impact, slow cost creep
Response
Review in a weekly model health meeting
Channel
Ticket or dashboard
Use error budgets for quality the same way SRE teams use them for availability. If you define a target such as a minimum groundedness score on sampled traffic, alert on the rate at which you burn that budget rather than on single bad readings. Pair each page-level alert with a runbook that names the fallback, whether that is the previous prompt version, a smaller and safer model, or a static response.
Route AI alerts through the paging and incident tooling your platform team already runs. Separate consoles for AI incidents tend to get checked late. Tracking mean time to detect and MTTR for AI incidents alongside other services keeps the practice honest and makes progress visible.
Human-in-the-Loop Review That Scales
Human-in-the-loop review routes a small, targeted slice of production outputs to people who label them, and those labels become the ground truth that calibrates the automated metrics. Reviewing a purely random sample wastes reviewer time on easy cases. Targeted queues give far more signal per hour of review.
Build queues from signals that predict problems: low judge scores, low model confidence, guardrail triggers, user thumbs-down, and segments flagged by drift checks. Give reviewers a short rubric that mirrors the automated evaluators, so human and machine scores can be compared directly. Record disagreements, since they show where your judge or thresholds need tuning.
Close the loop deliberately. Confirmed failures should land in the golden dataset within days, recurring patterns should trigger prompt or retrieval fixes, and enough accumulated labels can justify fine-tuning or retraining. Assign a named owner for the queue, because review backlogs without an owner go stale fast.
Governance and Regulatory Context
Monitoring records double as evidence for audits and regulators, which turns retention, access control, and version tagging into governance requirements rather than nice-to-haves. Under the EU AI Act, high-risk systems carry post-market monitoring duties alongside risk management, documentation, and human oversight. The timeline shifted in 2026, and according to a Mondaq analysis of the Digital Omnibus on AI, the application date for stand-alone high-risk systems listed in Annex III moved from 2 August 2026 to 2 December 2027.
The delay changes timing, not substance. Legal summaries of the Omnibus note that the core high-risk requirements remain in place, and several transparency and general-purpose AI obligations kept their original dates. If you serve EU users in high-risk categories, building monitoring that produces auditable traces now is cheaper than retrofitting it under deadline pressure, though you should confirm specifics with legal counsel.
Choosing Your Monitoring and Observability Tooling
Monitoring tools fall into a few broad categories, and many teams combine two of them: open-source tracing and evaluation platforms, full-stack observability vendors with AI features, specialist ML monitoring products, and do-it-yourself stacks built on OpenTelemetry and Prometheus. The right mix depends on where your telemetry already lives, how sensitive your payloads are, and whether you need to self-host. Guardrail libraries sit alongside all of these as a separate runtime layer.
Approach
Open-source LLM tracing and evals
Examples
Langfuse, Arize Phoenix
Strengths
Self-hostable, trace-centric, built-in eval workflows
Trade-offs
You run and scale it, and enterprise features vary by edition
Approach
Full-stack observability with AI modules
Examples
Datadog, New Relic, Dynatrace, Grafana Cloud
Strengths
AI telemetry next to app and infrastructure data, existing on-call integrations
Trade-offs
Model-specific depth varies, and ingest costs can climb with payload logging
Approach
ML monitoring specialists
Examples
Arize, Fiddler, Evidently
Strengths
Deep drift analysis and model-centric metrics
Trade-offs
Less context on surrounding services
Approach
DIY on open standards
Examples
OpenTelemetry Collector, Prometheus, Grafana, custom eval jobs
Strengths
Full control and no vendor lock-in
Trade-offs
Highest engineering and maintenance cost
Approach
Guardrail libraries
Examples
NVIDIA NeMo Guardrails, Guardrails AI
Strengths
Inline input and output checks
Trade-offs
Adds latency and needs its own monitoring
Ask a few questions before you commit. Can the tool ingest OpenTelemetry spans so you can switch backends later? Can you redact or hash sensitive fields before storage? Does it support custom evaluators and human review queues, or only built-in metrics, and how does pricing scale once you log full prompts and responses?
A full platform is not the right first step for everyone. If you run a single low-traffic internal model, structured logs, a weekly offline eval run, and a cost dashboard may cover you for months. Invest in heavier tooling when traffic, user exposure, or the number of models makes manual review impractical.
Limitations: What AI Monitoring Cannot Do
AI model monitoring shortens the time between a failure and its detection, but it cannot guarantee that a model is correct, fair, or safe. Treating dashboards as proof of quality is one of the more expensive mistakes a team can make. The limits below are worth stating plainly to stakeholders before they over-trust a green dashboard.
Automated evaluators are approximations. LLM judges carry known biases and can shift themselves when a provider updates the judge model.
Drift is not damage. Many distribution shifts leave outcomes unchanged, and some quality drops happen with no detectable input drift at all.
Labels arrive late or not at all. Many generative tasks have no single correct answer, so quality metrics remain estimates.
Logging creates risk. Storing prompts and responses can capture personal data, which brings retention, access, and regulatory obligations of its own.
Observability has a price. Tracing, payload storage, and judge calls add spend and some latency, which forces sampling decisions that leave gaps.
Standards are still settling. Semantic conventions for generative AI telemetry remain under active development, so instrumentation may need rework.
Metrics cannot fix a badly framed problem. If a model solves the wrong task or its training data encodes bias, monitoring will faithfully report a system that works as designed and still fails users.
A Production Monitoring Checklist
Use this checklist to confirm a model is observable before launch and stays that way afterward. Adapt thresholds and cadences to your traffic and risk level rather than copying them as fixed rules. Each item maps to a section above if you need the reasoning behind it.
Before Launch
Each model call, retrieval, and tool call emits a span with model, prompt, and index version tags
Sensitive fields are redacted or hashed in the collector before storage
A golden dataset with known hard cases runs in CI as a release gate
LLM judges are calibrated against human labels from your own domain
Baselines exist for quality, latency, cost per task, and guardrail trigger rates
Rollback paths and fallback models are documented in runbooks
At Launch
A shadow or canary rollout compares new and current versions on live traffic
Alerts are tiered by severity and routed to the existing on-call system
Dashboards show quality, drift, cost, latency, and safety per segment
Ongoing
Online evals score sampled traffic, with oversampling on high-risk segments
Drift checks run on inputs, outputs, and evaluator score distributions
Human review queues draw from low scores, guardrail triggers, and user feedback
Confirmed failures are added to the golden dataset
Judge agreement is re-checked after any judge or rubric change
Retention and access policies for stored payloads are reviewed with compliance
Putting Monitoring Into Practice
Effective monitoring for AI grows in layers: instrument first, then baseline, then evaluate, then automate alerts and review queues. Start with the signals that are cheap to collect, such as latency, cost, and error rates, and add quality evaluation for the workflows where a wrong answer costs the most. Revisit thresholds after each incident, because your first guesses will be wrong in ways only production traffic reveals.
Monitoring also depends on the delivery pipeline around it. Version tagging, CI gates, canary releases, and rollback paths are DevOps practices before they are ML practices, and AI model monitoring is only as reliable as the deployment process that feeds it. KriraAI builds and deploys production AI systems for enterprise teams, and if your release pipeline needs that foundation, explore our DevOps Solutions to see how we approach it.
FAQs
AI model monitoring is the ongoing measurement of a deployed model's quality, drift, cost, latency, and safety against expected baselines. It raises alerts when those signals move outside agreed limits so teams can fix problems before users notice them.
Monitoring tracks predefined metrics and alerts when they cross thresholds. Observability adds traces, logs, and stored payloads that let engineers explain why something failed, including failures nobody predicted.
Yes, by tracking proxy signals such as LLM judge scores, user feedback, refusal rates, and drift in inputs and outputs. Confirm suspected problems by labeling a targeted sample instead of waiting for full ground truth.
Not entirely. LLM judges scale well and can approach human-level agreement on some tasks, but they carry biases, so a smaller human review loop is still needed to calibrate them and catch what they miss.
It depends on traffic volume and how quickly your inputs change. High-traffic systems often compute drift hourly or daily, while low-volume models need longer windows to collect statistically meaningful samples.
Yes, for latency, error, cost, and token metrics, especially if you instrument with OpenTelemetry. You will usually need an additional trace store and evaluation tooling for prompt-level debugging and quality scoring.
In most implementations the system returns a safe fallback, such as a refusal, a templated message, or a handoff to a human, and logs the event with its trace. Blocked requests should be sampled for review to catch false positives.
Span collection usually adds little latency when spans are exported asynchronously, but storing full payloads and running LLM judges adds real cost. Sampling, redaction, and tiered retention keep that overhead manageable.
Ownership usually works best when split between them. The platform team owns instrumentation, pipelines, and alert routing, while the ML or product team owns quality metrics, evaluators, and thresholds for its models.
No, monitoring supports compliance by producing evidence such as traces, version records, and incident logs, but it is only one part of the obligations. High-risk systems also need risk management, documentation, and human oversight, so confirm requirements with legal counsel.
Krushang Mandani is the CTO at KriraAI, driving innovation in AI-powered voice and automation solutions. He shares practical insights on conversational AI, business automation, and scalable tech strategies.