AI-Powered Student Success Platform Built for K-12 Education
For most large school systems, the tragedy of a student dropping out does not arrive without warning. It arrives after dozens of small, missed signals, an attendance dip in October, a grade that slipped in January, a counsellor who had 420 students on their caseload and no system to tell them which five needed a conversation today. AI in education has been discussed as a transformative force for more than a decade, but the gap between conference keynotes and production systems that actually work inside real school infrastructure has remained stubbornly wide. This blog tells the story of how KriraAI closed that gap for a large K-12 education enterprise managing over 85,000 students across 64 campuses, building a production-grade AI early-warning and personalised learning platform that went live in under seven months and changed how the organisation understood and responded to student risk.
The engagement covered the full delivery lifecycle: problem discovery, data architecture, model design, integration with legacy SIS and LMS platforms, MLOps infrastructure, and a counsellor-facing intervention interface that staff actually adopted. By the end of the first academic year post-deployment, the system had identified at-risk students an average of 34 days earlier than previous manual review processes, reduced dropout rates by 41 percent in the cohorts it monitored, and saved the district an estimated 2,300 counsellor-hours per semester. This blog walks through exactly what KriraAI built, why the architecture was designed the way it was, what the implementation journey looked like from the inside, and what the results confirmed.
The Problem KriraAI Was Called In To Solve
The education enterprise that engaged KriraAI was not failing in the conventional sense. Its campuses were staffed, its systems were running, and its administration had genuine commitment to student outcomes. The problem was structural and data-architectural: the organisation was generating enormous volumes of student behaviour and performance data every single day, and almost none of it was being converted into timely, actionable intelligence.
Attendance data lived in one system. Gradebook data lived in another. Behavioural incident logs sat in a third. Counsellor notes were stored in a combination of a CRM-adjacent platform and individual staff spreadsheets. The LMS captured assignment completion rates, time-on-task metrics, and login frequency, but that data had never been joined to the SIS records at the student level in any systematic way. The result was that each of these data sources told a fragment of a story, and no one in the organisation had the tools or the time to assemble the fragments into a coherent picture of individual student risk.
Counsellors were operating reactively. By the time a student arrived on a counsellor's radar through the existing referral process, the student had typically already experienced a sequence of compounding failures: weeks of irregular attendance, a cluster of failing assignment grades, and often a disciplinary event. Intervening at that point was harder, more resource-intensive, and statistically less effective than intervening earlier. The counsellors understood this clearly. Their frustration was not with their work but with the absence of any system that could surface the early signals before the crisis consolidated.
The scale of the problem compounded the difficulty. With 85,000 students distributed across 64 campuses and a counsellor-to-student ratio that in some schools exceeded 1:450, the idea that trained professionals could manually monitor early-warning indicators for every student was not a realistic expectation. Counsellors were triaging constantly, serving the students who had already escalated visibly, and inevitably missing the students who were quietly disengaging before that escalation arrived.
There was also a personalised learning dimension to the problem. The organisation had invested significantly in a modern LMS and a library of digital curriculum content, but content delivery remained largely uniform. Students who were struggling with foundational concepts received the same instructional sequence as students who had already mastered those concepts. Teachers had neither the bandwidth to design individualised learning paths for every student nor the analytical tools that would have made that task tractable. The gap between the aspiration for differentiated instruction and what was actually happening in classrooms was wide and growing.
The financial cost of this gap was calculable and significant. Each student who dropped out of the K-12 system carried a measurable economic cost to the district in lost per-pupil funding, in the social service and remediation costs that typically follow early school departure, and in the long-term fiscal impact of reduced workforce participation. The organisation's own internal analysis put the per-dropout economic cost to the district at approximately $9,400 when downstream costs were included. With hundreds of students dropping out annually across the 64-campus system, the aggregate cost was in the tens of millions. Leadership had concluded that the status quo was no longer a defensible position, and that the data infrastructure they had already built was sufficient to power something meaningfully better if the right AI architecture was applied on top of it.
What KriraAI Built
KriraAI designed and delivered a two-component AI platform: a student risk intelligence system and a personalised learning pathway engine. Both components shared a unified data foundation and were served through a single counsellor and teacher-facing interface, but they addressed distinct operational problems and were architected with different model families and inference requirements.
The student risk intelligence system was built around a transformer-based sequence model trained on longitudinal student event streams. Rather than treating student risk as a static snapshot prediction problem, KriraAI framed it as a sequence classification task over temporally ordered behavioural events. Each student's record was represented as a time-ordered sequence of events drawn from five source systems: attendance logs, gradebook updates, LMS engagement telemetry, disciplinary records, and counsellor interaction logs. The model consumed windows of up to 90 days of event history and produced a calibrated risk score updated every school day, along with a ranked list of the specific contributing signals driving the score. This interpretability layer was not cosmetic. Counsellors needed to understand why a student had been flagged before they could have a productive conversation about it, and a black-box score would have generated distrust and low adoption.
The personalised learning pathway engine was built on a different architecture: a graph neural network trained over a knowledge graph of curriculum concepts, prerequisite relationships, and student mastery evidence. Each student's demonstrated competency profile, derived from gradebook data and LMS assessment completions, was embedded into the knowledge graph and used to identify the specific concept gaps most likely to be limiting their forward progress. The system generated daily-updated learning pathway recommendations for each student, specifying which content modules to prioritise and in what sequence, and surfacing those recommendations to teachers through a lightweight integration with the existing LMS.
Both systems fed into a unified delivery layer. KriraAI built a Next.js counsellor dashboard that presented risk scores, contributing signals, intervention history, and recommended next actions in a single view per student. The same backend served a teacher-facing module inside the LMS through an API integration that displayed personalised pathway recommendations without requiring teachers to leave the tools they already used daily. The system was designed from the start for adoption by people who were not AI specialists, and every interface decision reflected that constraint.
Solution Architecture: How KriraAI Engineered AI in Education at Scale
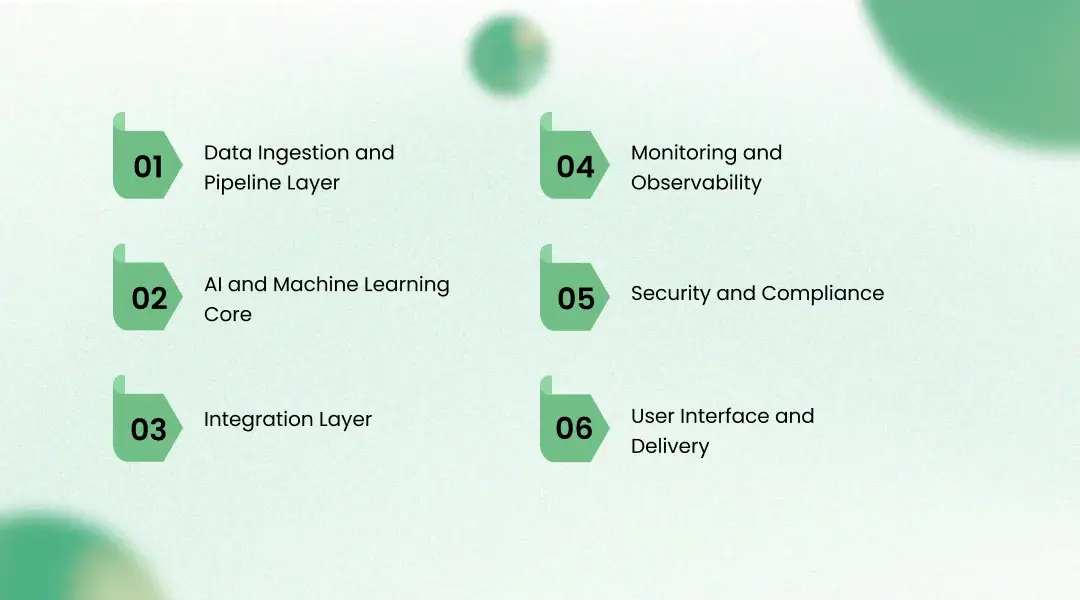
Data Ingestion and Pipeline Layer
The data foundation of the platform was a unified student event stream, built on a change data capture architecture that propagated updates from five operational source systems into a central event store in near real time. KriraAI deployed Debezium connectors against the SIS PostgreSQL database and the gradebook system, capturing row-level change events and publishing them to Apache Kafka topics partitioned by student identifier. LMS engagement events, which were generated at much higher volume and frequency, were streamed directly from the LMS event emission API into a separate Kafka topic with a retention window of 90 days.
Apache Flink processing jobs consumed these Kafka streams and performed the transformation logic required to convert raw operational events into the feature-rich student event records the models consumed. The Flink jobs handled schema normalisation across the five heterogeneous source systems, temporal feature engineering including rolling attendance rate calculations, grade velocity computation, LMS session frequency binning, and entity resolution to handle the student identifier inconsistencies that existed across legacy systems. Processed events were written to a Parquet-partitioned data lake on object storage, and a feature store layer built on Redis served the online serving path with precomputed student feature vectors updated on a sub-hour cadence.
Apache Airflow orchestrated the batch components of the pipeline, including the nightly recomputation of full 90-day event windows for model inference, the weekly knowledge graph embedding refresh for the learning pathway engine, and the monthly retraining data preparation jobs.
AI and Machine Learning Core
The risk prediction model was a temporal transformer architecture with multi-head self-attention over student event sequences. The model was pre-trained on a synthetic event corpus generated by data augmentation over the client's historical student records, then fine-tuned on five years of labelled outcomes data in which the labels were derived from enrolment status at the end of each academic year. Supervised fine-tuning used a focal loss function weighted to address the significant class imbalance in dropout prediction tasks, where at-risk students represent a minority of the overall population. The model was served using vLLM-compatible batched inference for the sequence classification task, with quantisation applied via GPTQ to reduce memory footprint during inference without meaningful degradation in predictive accuracy.
The knowledge graph for the learning pathway engine was constructed from the curriculum taxonomy maintained by the organisation's instructional design team, enriched with prerequisite edges derived from item response theory analysis of historical assessment performance data. Student mastery embeddings were generated using a contrastive learning objective that positioned students with similar demonstrated competency profiles close together in embedding space. The graph neural network used a GraphSAGE architecture with neighbourhood aggregation over two-hop concept neighbourhoods to generate personalised pathway recommendations. Both models were tracked in MLflow, with model versions, hyperparameter configurations, and evaluation metrics stored for full reproducibility.
Integration Layer
KriraAI designed the integration layer around an event-driven architecture using Apache Kafka as the central message bus. AI inference outputs, including daily risk scores and pathway recommendations, were published as structured events to output Kafka topics consumed by downstream integration services. A gRPC-based inference service handled low-latency synchronous requests from the counsellor dashboard, returning risk scores and contributing signals within 200 milliseconds at p95 for individual student lookups. REST API contracts with semantic versioning governed the integration between the AI backend and the LMS, ensuring that LMS-side updates could not silently break the pathway recommendation delivery without a contract version bump triggering alerts.
Webhook-based triggers connected the risk scoring system to the district's existing case management platform, automatically creating counsellor task records when a student's risk score crossed a defined threshold for three consecutive school days, providing durable audit trails of when AI-flagged risk was surfaced to human staff.
Monitoring and Observability
KriraAI implemented a comprehensive MLOps monitoring layer addressing both data quality and model performance concerns. Data drift was tracked using population stability index computed weekly against a baseline feature distribution established at model training time, with automated alerts firing when PSI exceeded 0.2 for any high-importance feature. Model performance was tracked against a continuously updated held-out evaluation set drawn from the most recent 60 days of resolved student outcomes, with F1 score, precision, and recall reported daily. Latency was instrumented at p50, p95, and p99 percentiles using Prometheus metrics exported to Grafana dashboards monitored by the KriraAI platform team. Automated retraining triggers were configured to fire when model F1 score on the evaluation set fell below 0.78 or when PSI breached thresholds on more than three features simultaneously.
Security and Compliance
Student data carries strict regulatory obligations under FERPA, and the architecture was designed with compliance as a first-class constraint from day one. All student data was processed within a private VPC with no public endpoints exposed. Role-based access control with attribute-level data masking ensured that counsellors could only access risk data for students on their assigned caseloads, and that teacher-facing pathway recommendations contained no sensitive behavioural or disciplinary signals. Model inputs and outputs were encrypted end to end using AES-256 in transit and at rest. Audit logging to an immutable append-only store captured every data access event, every API call to the inference service, and every counsellor action taken within the dashboard, providing the district's data governance team with a complete audit trail for compliance reporting.
User Interface and Delivery
The counsellor dashboard was built in Next.js with a server-side rendering architecture that ensured fast initial page loads even on the lower-bandwidth connections common in older school buildings. The interface presented each student's risk score as a calibrated probability with a plain-language explanation of the top three contributing signals, an intervention recommendation based on the specific risk profile, and a longitudinal trend chart showing the student's score trajectory over the preceding 90 days. The teacher LMS integration was delivered as a lightweight iframe widget embedded in the existing LMS course pages, surfacing personalised next-step recommendations without requiring teachers to navigate to a separate system.
Technology Stack
The technology choices across the platform were deliberate, grounded in the specific constraints of the education environment, and justified by the performance characteristics of each tool at the scale required.
Data Infrastructure
Apache Kafka on Confluent Cloud was selected for its mature exactly-once delivery semantics and the district's existing Confluent licensing, avoiding the operational overhead of a self-managed Kafka cluster.
Apache Flink for stream processing was chosen over Spark Streaming because of Flink's native event-time processing semantics, which were essential for handling the irregular event timestamps produced by legacy school systems.
Apache Airflow for batch orchestration was selected because the district's data engineering team already had Airflow experience, reducing onboarding friction during handover.
A Delta Lake table format on AWS S3 provided ACID transactions for the data lake layer, enabling reliable upsert operations for the frequent corrections that arrived from source systems.
AI and ML Platform
PyTorch for model development, selected for its dynamic graph construction which simplified the variable-length sequence handling required by the temporal transformer.
MLflow for experiment tracking, model versioning, and registry management, providing the reproducibility guarantees required by the district's model governance policy.
vLLM for batched inference serving of the sequence classification model, providing the throughput required to recompute risk scores for 85,000 students nightly within a four-hour inference window.
Redis as the online feature store, selected for its sub-millisecond read latency required by the synchronous counsellor dashboard API path.
Infrastructure and Delivery
AWS as the cloud platform, selected because the district already operated its SIS and data warehouse on AWS, minimising cross-cloud data transfer costs and latency.
Kubernetes on EKS for containerised service orchestration, enabling independent scaling of the inference service, the feature store refresh jobs, and the API gateway.
Next.js for the counsellor dashboard, selected for its server-side rendering capabilities and the team's existing React expertise.
Prometheus and Grafana for operational monitoring, chosen for their mature Kubernetes-native integration and the district's existing Grafana licensing.
How We Delivered It: The Implementation Journey
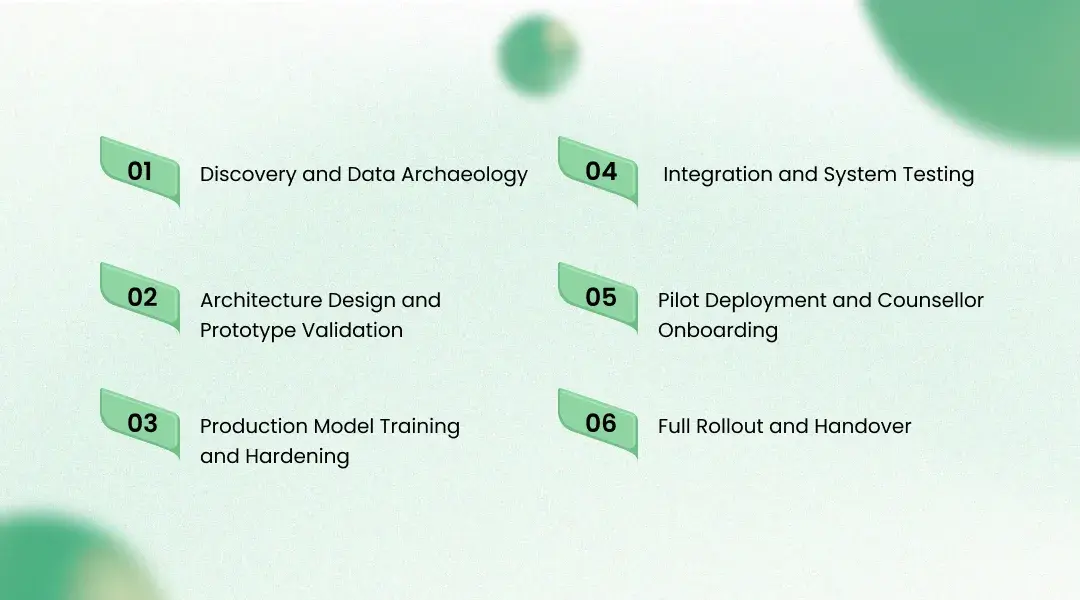
Phase 1: Discovery and Data Archaeology
The first four weeks of the engagement were spent entirely on data archaeology. KriraAI's data engineers connected to all five source systems and performed a systematic audit of data quality, schema consistency, historical depth, and entity resolution challenges. This phase surfaced the most consequential problem of the entire project: student identifiers were inconsistent across the SIS and the LMS. A non-trivial proportion of students had different ID formats in the two systems due to a legacy migration performed five years earlier, and this inconsistency would have silently corrupted the joined event streams if it had not been caught and resolved before model training began. KriraAI built a probabilistic entity resolution system using name, date of birth, and campus attributes to reconcile the identifiers with greater than 99.3 percent accuracy, and the resolution mapping was persisted and maintained as a first-class pipeline artifact.
Phase 2: Architecture Design and Prototype Validation
With clean data flowing, KriraAI's ML team built rapid prototype versions of both model architectures against 18 months of historical data. The prototype risk model achieved an AUC of 0.84 on a held-out validation set, confirming that the signal quality in the event streams was sufficient to support production-grade prediction. The knowledge graph prototype demonstrated that the curriculum taxonomy required significant enrichment before the GNN could generate coherent pathway recommendations. KriraAI worked with the district's instructional design team over three weeks to add 1,400 prerequisite edges to the curriculum graph that were missing from the original taxonomy documentation.
Phase 3: Production Model Training and Hardening
Full production model training used five years of historical student records covering approximately 310,000 student-year observations. The training pipeline ran on an AWS SageMaker distributed training cluster across eight ml.p3.2xlarge instances. The most significant challenge in this phase was the class imbalance: at-risk students who ultimately dropped out represented approximately 6.2 percent of the labelled dataset, and early training runs produced models with high accuracy but unacceptably low recall on the minority class. KriraAI addressed this through a combination of focal loss weighting, synthetic minority oversampling using SMOTE applied to the tabular feature space, and threshold calibration on the validation set to optimise for the recall-precision tradeoff that counsellors required in practice.
Phase 4: Integration and System Testing
Integration with the SIS and LMS required navigating API rate limits, inconsistent webhook reliability in the legacy case management platform, and a data governance review process that required formal approval for each new data flow between systems. The governance review introduced a three-week delay that KriraAI absorbed by advancing parallel workstreams on the dashboard UI and the monitoring infrastructure. The LMS API integration initially returned malformed JSON for students enrolled in more than 12 courses simultaneously, a bug in the LMS vendor's API that KriraAI identified, documented, and worked around with a client-side normalisation step while the vendor prepared a patch.
Phase 5: Pilot Deployment and Counsellor Onboarding
The platform launched in a controlled pilot across six campuses covering approximately 7,800 students. KriraAI ran two full weeks of parallel operation, with counsellors receiving both the AI risk flags and the traditional manual referral signals simultaneously, so that the agreement and disagreement between the two could be reviewed and used to calibrate counsellor trust in the system. The onboarding sessions focused heavily on the interpretability layer. Counsellors who understood the specific signals driving a student's risk score were significantly more likely to act on the recommendation than those who received only the score itself.
Phase 6: Full Rollout and Handover
Full rollout across all 64 campuses was completed in week 28 of the engagement. KriraAI produced a comprehensive technical runbook, trained the district's internal data engineering team on the pipeline architecture and the Airflow DAG structure, and established a shared Slack-based support channel for the 90-day hypercare period following go-live. The MLOps monitoring dashboards were transferred to the district's platform team with a documented escalation path for the automated retraining triggers.
Results the Client Achieved
The outcomes measured at the end of the first full academic year following platform deployment confirmed the business case that had motivated the engagement.
Student Outcome Metrics
Dropout rate in the monitored cohort fell by 41 percent compared to the prior academic year baseline, representing 187 fewer students leaving the school system.
At-risk students were identified an average of 34 days earlier than through the previous manual referral process, expanding the intervention window substantially.
Counsellor intervention success rate, defined as a risk-flagged student returning to green status within 60 days of first intervention, reached 67 percent, compared to a 43 percent rate recorded in the pre-platform historical data.
Operational Efficiency Metrics
Counsellor time spent on manual data review and case identification fell by an estimated 2,300 hours per semester across the counsellor population, time that was reallocated to direct student contact.
Teacher time spent on individual learning path planning fell by approximately 1,800 hours per semester as the pathway recommendations automated the diagnostic and prescriptive planning work.
System p95 inference latency for individual student risk lookups measured 178 milliseconds in production, comfortably within the 200-millisecond target established during architecture design.
Learning Outcome Metrics
Students receiving personalised pathway recommendations through the LMS integration completed assigned modules at a rate 28 percent higher than the comparison group receiving standard course sequencing. Assessment pass rates in the first attempt rose by 19 percent among students whose learning pathways were actively followed by their teachers.
These results were measured across the full 85,000-student population over the 10-month post-deployment observation period. The district's data team independently verified the outcome metrics against their historical cohort data, confirming that the improvements were attributable to the platform's interventions rather than to external demographic or economic shifts in the student population.
What This Architecture Makes Possible Next
The platform KriraAI delivered was designed not as a finished product but as a composable AI foundation that the organisation can extend without rebuilding. Several dimensions of extensibility were engineered into the architecture from the start.
The temporal transformer risk model was trained on five behavioural signal types, but the event stream architecture supports the addition of new signal types without retraining the full model from scratch. The district is currently instrumenting two additional data sources: a family engagement platform that captures parent-school communication frequency, and a meal programme system whose participation patterns carry established correlations with food insecurity and attendance risk. When these streams are connected to the Kafka pipeline, they will be incorporated into the feature engineering layer and the model will be fine-tuned incrementally on the enriched signal set, a process the ML team can execute in approximately two weeks per new signal type.
The knowledge graph architecture for the learning pathway engine is directly extensible to new subject areas and grade bands. The district has plans to expand the curriculum graph from its current coverage of mathematics and English language arts to include science and social studies by the following academic year. Because the GNN architecture learns over graph structure rather than fixed feature vectors, adding new concept nodes and prerequisite edges does not require retraining from scratch. The embedding space can be updated through an efficient graph induction step that positions new nodes relative to existing ones using their structural neighbourhood.
At the infrastructure level, the Kubernetes deployment on EKS provides horizontal scaling headroom that the district has not yet needed to use. The current cluster handles the 85,000-student population with significant spare capacity. As the district considers whether to offer the platform capabilities to neighbouring districts through a consortium arrangement, the architecture can scale to three to four times the current student population with infrastructure changes limited to node count adjustments and Kafka partition scaling, neither of which requires application-layer rework.
The audit logging and FERPA compliance infrastructure also positions the district to participate in the emerging student data portability frameworks being developed at the state level. Because every data access and model inference event is logged to an immutable store, the district can produce complete student data processing records on demand, a capability that will become a regulatory requirement in several states within the next two to three years.
Conclusion
Three insights from this engagement stand out as the most transferable to other AI in education implementations. The first is technical: the quality of the entity resolution work before model training matters more than the sophistication of the model architecture. A temporal transformer trained on accurately joined student records will outperform any architecture trained on corrupted joins. The second is operational: counsellor adoption is the deployment problem that determines whether the system creates value, and adoption is driven by interpretability, not accuracy. The third is strategic: AI platforms built as composable foundations with event-driven data architectures and extensible knowledge graphs compound in value over time, while point-solution AI tools do not.
KriraAI brings this same level of engineering depth and delivery discipline to every client engagement, combining serious AI science with the systems thinking required to make models work inside real enterprise infrastructure. The work described in this blog was not a proof of concept. It was a production system, hardened for scale, designed for adoption, and measured against real student outcomes. That is the standard KriraAI holds itself to on every engagement.
If you are leading a school district, an education technology organisation, or a government education body and you are navigating a version of the problem described in this blog, bring that challenge to KriraAI. The engineering foundation exists. The delivery experience is real. Let us build it with you.
FAQs
AI reduces student dropout rates in a production school system by transforming the identification of at-risk students from a reactive, referral-based process into a proactive, continuously updated signal system. The platform KriraAI built processes daily event streams from five operational systems, including attendance logs, gradebook updates, and LMS engagement telemetry, using a temporal transformer model to compute calibrated risk scores for every student in the system each school day. By surfacing at-risk students an average of 34 days earlier than the previous manual process, the system expands the intervention window to a period when counsellor support is statistically more effective. The key is not the model in isolation but the combination of early identification, interpretable contributing signals that guide the counsellor conversation, and an integration with the case management system that ensures flagged risk translates into a scheduled action rather than an unread alert. The measured outcome across 85,000 students was a 41 percent reduction in dropout rates within the first academic year post-deployment.
A reliable AI student risk prediction system requires longitudinal, multi-dimensional student event data joined at the individual student level. At minimum, the system needs attendance records with daily granularity going back at least two to three academic years, gradebook data with assignment-level timestamps rather than only period grades, and LMS engagement telemetry covering login frequency, time-on-task, and assignment completion rates. The system KriraAI built used five years of historical records covering approximately 310,000 student-year observations. Critically, data quality and entity resolution across source systems matter more than data volume. The engagement surfaced a student identifier inconsistency between the SIS and LMS that, if unresolved, would have corrupted approximately 12 percent of joined event records. Organisations evaluating AI in education must invest in the data infrastructure work before the model work. A well-designed model trained on corrupted joins will underperform a simpler model trained on clean, consistently resolved data.
The right architecture for personalised learning at scale in a K-12 school district is a knowledge graph-based recommendation system that represents curriculum concepts and their prerequisite relationships as a structured graph and positions each student's demonstrated mastery profile within that graph. The approach KriraAI used builds a graph neural network over the curriculum taxonomy, using a GraphSAGE architecture with two-hop neighbourhood aggregation to generate pathway recommendations that reflect both a student's current competency gaps and the structural dependencies of the concept graph. This architecture outperforms matrix-factorisation collaborative filtering approaches because it can generalise to students with sparse assessment histories by leveraging the graph structure of the curriculum. It also allows the curriculum itself to be updated without retraining the full model, since new concept nodes can be inducted into the embedding space from their structural neighbourhood. The system generated recommendations that led to a 28 percent improvement in module completion rates among students whose pathways were actively followed.
A school district evaluating AI vendors for early-warning student systems should assess five dimensions: data architecture maturity, model interpretability, integration with existing SIS and LMS platforms, compliance with FERPA and applicable state student privacy laws, and the vendor's MLOps capability for long-term model maintenance. Interpretability deserves particular emphasis. Counsellors will not act on a risk score they cannot explain to a student or parent, and districts that have deployed black-box risk systems have reported low adoption rates and legal exposure from decisions that cannot be traced to specific, articulable evidence. Vendors should be able to demonstrate that their models produce ranked contributing signals alongside scores, that those signals are drawn from data the district legally owns and has authorised for this purpose, and that the model can be audited by the district's data governance team. Retraining and drift monitoring commitments should be contractual, not optional, because student population characteristics shift annually with cohort transitions and demographic changes.
Implementing a production-grade AI in education platform for a large school district typically takes between 24 and 32 weeks from discovery to full rollout, assuming the district has multi-year historical data available in accessible systems and a dedicated internal technical point of contact. The engagement KriraAI completed for a large K-12 enterprise covering 85,000 students across 64 campuses was delivered in 28 weeks, including data archaeology, entity resolution work, prototype validation, production model training, integration development, pilot deployment across six campuses, and full system rollout. The phases with the highest variability in duration are the data archaeology and governance review phases, which depend heavily on the district's existing data quality and the speed of its internal approval processes. Districts that have invested in modern SIS platforms, clean data pipelines, and clear data governance policies will reach production faster than those inheriting legacy systems with inconsistent schemas and fragmented identity management.
Founder & CEO
Divyang Mandani is the CEO of KriraAI, driving innovative AI and IT solutions with a focus on transformative technology, ethical AI, and impactful digital strategies for businesses worldwide.